Blueprint Coverage Maps
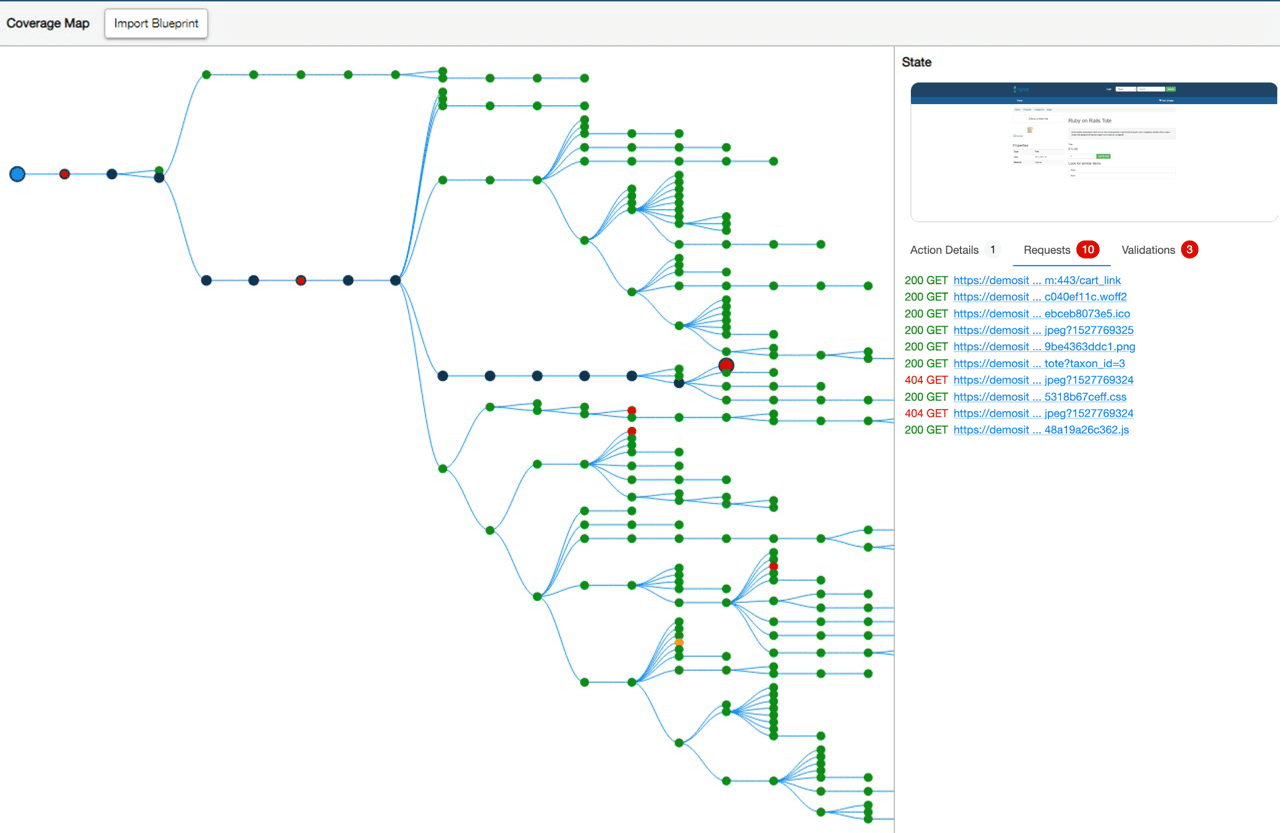
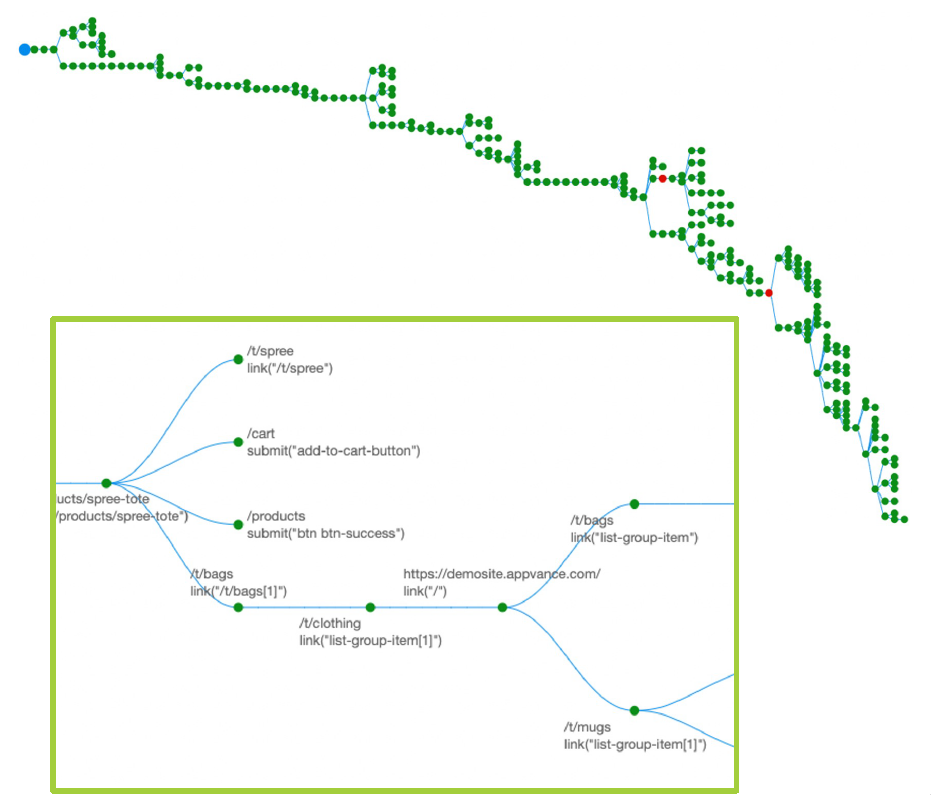
The AIQ Blueprint Coverage Map shows you the multiple paths that the AI can take while interacting with the application being tested.
A Coverage Map allows you to visualize the health of the application being tested and understand all the potential user flows. You can easily see areas of the application that might be plagued by errors and require rework. Over time, the historical progression of the Coverage Map will also help you see where there is degrading performance, unexpected defect density, or other changes.
Exploring the Coverage Map
-
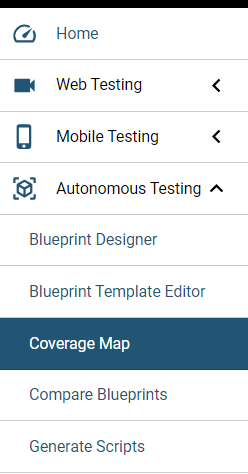
Navigate to Autonomous Testing > Coverage Map.
Depending on which version of AIQ you are using the first level choice might be named AI Scripting.

-
Click Import Blueprint.
-
From your repository, open an existing blueprint. Large blueprints may take awhile to load.
-
The Coverage Map opens.

-
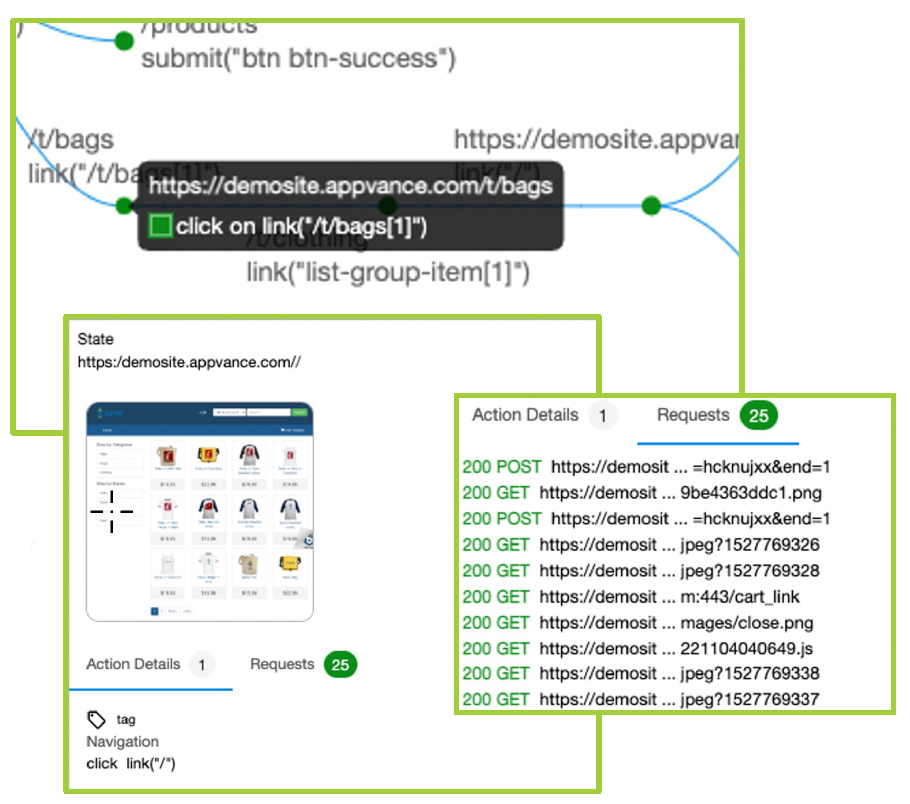
Explore the Coverage Map. You can to zoom in and zoom out to see more details including which actions and accessors are associated with a specific node.

-
Click a specific node to see the actions and accessors. From here you will also see their exact location within the application being tested. You can further expand the information to see the associated requests.

Interpreting the Coverage Map
The colors of the various elements have the following meanings:
-
White: Not executed
-
Green: Executed
-
Yellow: Multiple states
-
Red: Failure during execution
-
Blue: The execution path from the start point