Dashboards Explained:
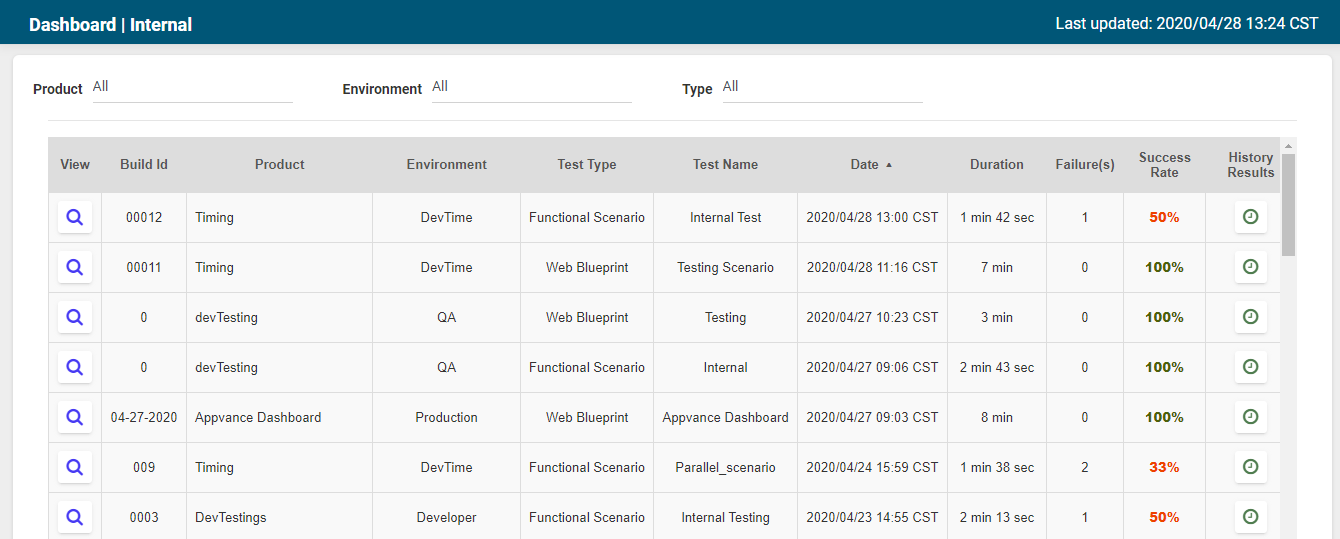
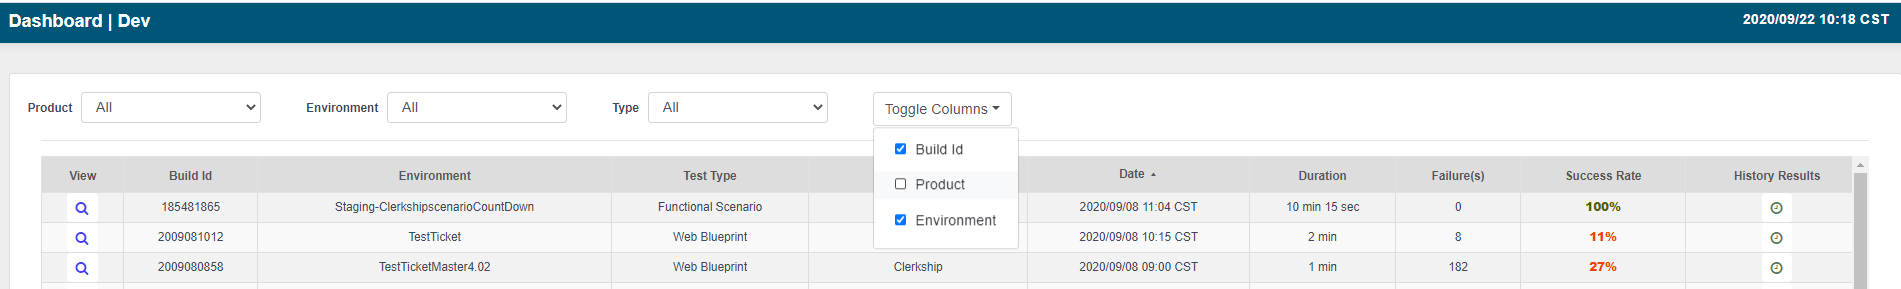
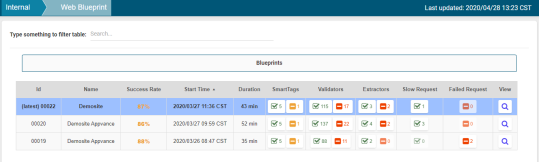
The main dashboard looks like the below:
-
The main dashboard will have all the entries for the scenarios and the blueprints run for the application under test
-
The top right will have last updated with the date and time
-
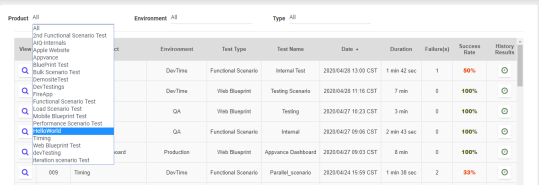
Product is a drop-down field that lists out all the products of the dashboard, remember product was a property that was set in build.xml, and based on the provided value, a dashboard would be created
-
The environment is again a drop-down field that lists out all the environments, remember environment is again a property that was set in build.xml, and based on the provided value, dashboards would be created or updated
-
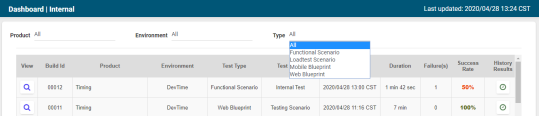
Type Lists out all the test types, like functional scenarios, blueprints etc
-
Build id - is again is a value provided in build.xml, it can be driven to be dynamically generated from other tools like Jenkins.
From Jenkins:
buildNumber=Appvance$BUILD_NUMBER
$BUILD_NUMBER is an inbuilt method that creates a build number by itself so every time a pipeline is run, a number would be appended to Appvance (Example: Appvance01)
Within Build.xml:
Below example shows picking today's date as the build number which is defined inside build.xml as shown below:
<property name="buildVersion" value="${TODAY_MY}" />
<tstamp>
<format property="TODAY_MY" pattern="MM-dd-yyyy" locale="en,US" />
</tstamp>
-
Test Name - It is the name of the test scenario name/blueprint execution name
-
Date - Date of when the blueprint or the test scenario was run
-
Duration - is the pipeline duration
-
Failures - will show the number of script failures for scenarios and the number of validation failures for blueprints
-
Success Rate - Success rates in percentage for both Scenarios and blueprints
-
Toggle Columns - You have options to toggle columns with Build Id, Product, Environment
Products and Environments:
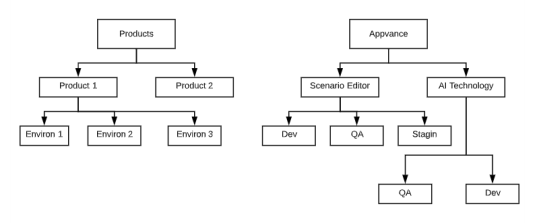
Environments:
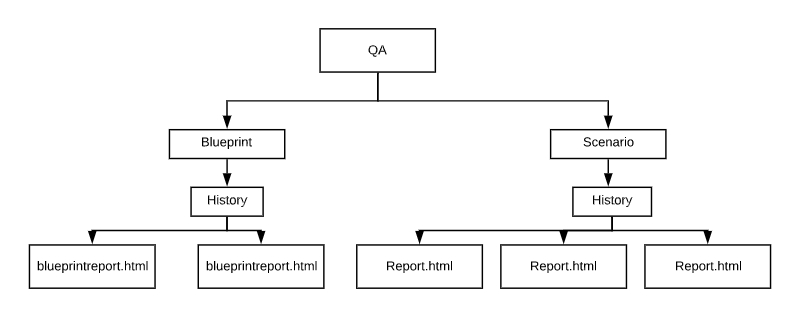
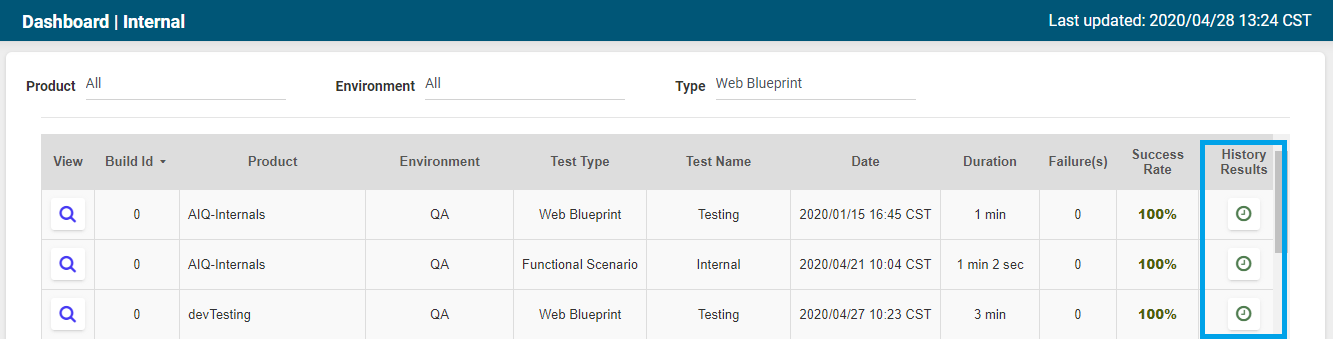
History Results:
Click the icon for each of the entries under History Results to check the history results for a scenario run based on product/Environment/Test Type (Blueprint or Scenario)
Blueprints:
-
It has a search option on top so you can search for something specific, like dates, build number, etc
-
ID is the same as the build number
-
Name is the name of the blueprint
-
Success rate gives the success rate of the blueprint, if there are some validation failures, those can be checked using Validators
-
Start Time - shows when the blueprint was started
-
Duration - shows how long the blueprint was run
-
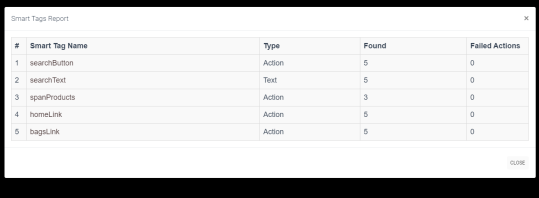
SmartTags - shows all the SmartTags that were used in the Green tick box and also the ones that are not used in the orange box. You can click them for a quick view
-
Validations - will list all the successful validations and the failed validations, just like SmartTags, you can open the quick view to list out all the validations that were passed and all the validations that were failed
-
Extractions - will list all the successful and failed extractions and you can use the quick view to see the list of successful extractions and the failed ones
-
Slow requests - Depending on the user entry in the build.xml to filter out the slow responses (like 2000 msecs) - this will list out all the slow requests
-
Failed Requests - Depending on the user entry in the build.xml to filter out all the failed requests (302 and above) - this will list out all the failed requests
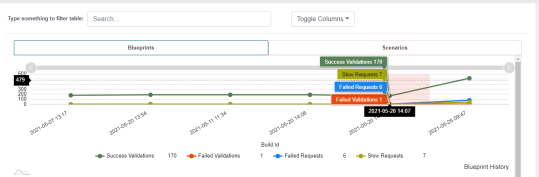
The graph shows successful and failed validations, slow and failing requests over a period of time. You can mouse hover on both graphs to get more details.
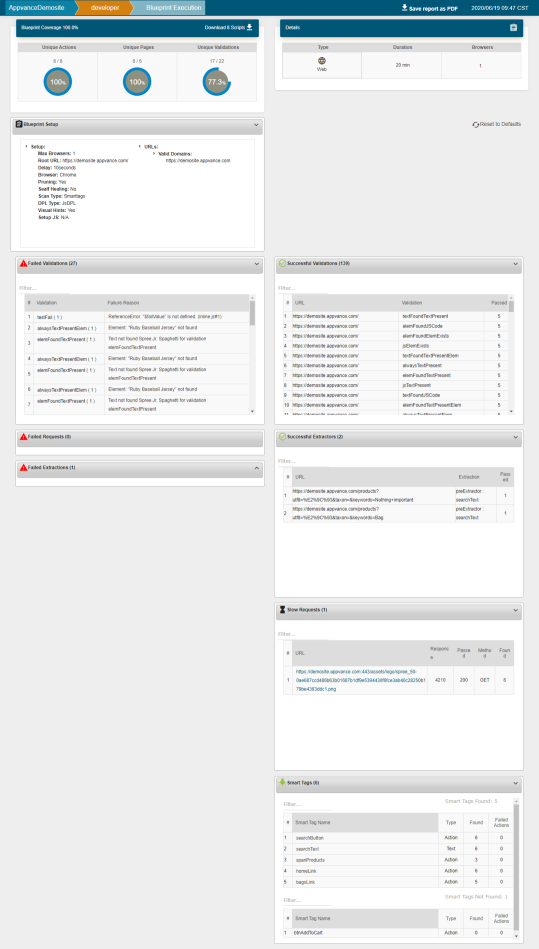
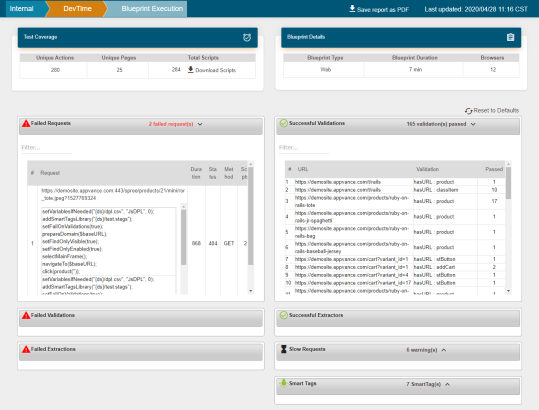
View:
-
Test Coverage shows all the Unique Actions created, Unique pages found statistics and total scripts created, and an option to download all the JS scripts created from the blueprint
Coverage is basically:
The list of unique actions is divided by total actions, The list of unique pages divis ided by total pages found, then both results are summarized and divided into 2, so the coverage is an average of the percentage of actions and pages found, Just those values are considered to generate the final value.
-
Blueprint section details will show the blueprint type (Web or Mobile), Blueprint duration in minutes, and the number of browsers
-
Below sections - Failed Validations, Failed Requests, Failed Extractions, Successful Validations, Successful Extractions, Slow Requests, SmartTags-All can be expanded and collapsed
-
These sections can be dragged and dropped based on user needs, like dragging all the failed sections to one side and all the successful sections to the other side, even if the browser is refreshed, these sections stay as the user made changes
-
Reset to Defaults can be used to re-arrange the sections as default options
-
Each of the sections will have a Filter option to filter out based on the needs
-
Under failed requests, you can expand a particular request and copy the generated script which can be pasted in JS Edit & Play to be replayed back. The same applies to slow requests as well.
-
The entire report can be downloaded as pdf using Save report as PDFon top of the page next to the Last updated
Scenarios:
-
Just like a blueprint, a search option is available to filter out the entries
-
ID is the build-id
-
NameThen is the scenario name
-
Type shows if it is a functional, performance, or bulk scenario type
-
Initial Time - This shows when the scenario started executing
-
Success/Failure - This shows the list of success test cases and failed test cases, you can click the quick view to see the full list
-
Success percentage - This shows the success percentage
-
Duration - This shows the duration of the scenario run from AIQ. When scenarios are run in parallel, the duration will show the duration of the scenario which took longer. When scenarios are run in sequence, the duration will show the duration of all the scenarios summed up.
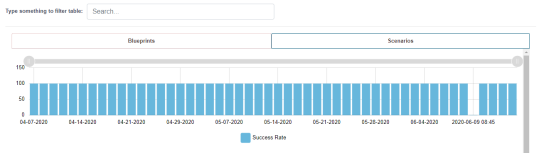
You will also be able to view the graphs of history on the success and failure of the scenarios over a period of time
View:
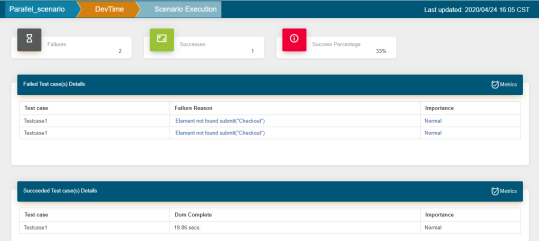
-
On top, it lists out the total Failures, Successes, and Success Percentages
-
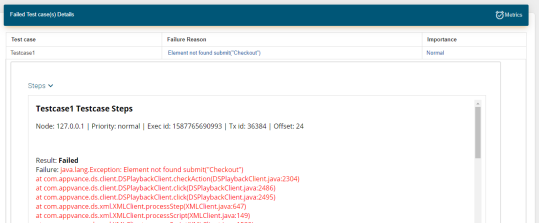
Failed test case detailed section lists all the test cases that were failed and a one-line Failure reason with the importance set in the Scenario Editor test case section
-
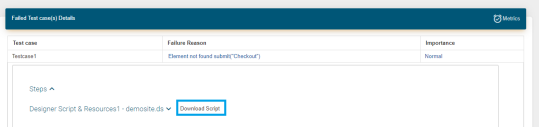
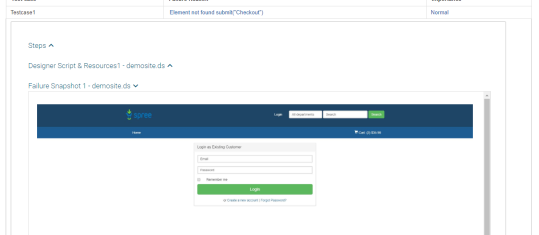
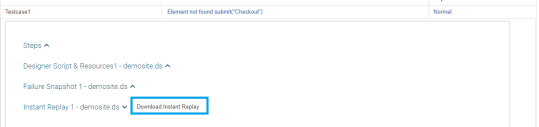
You can expand each of the test cases to look at more details on the failure like Steps, script and resources to download, Failure snapshot, Instant replay to download, Failure snapshot of step highlighted, Trace, and error logs
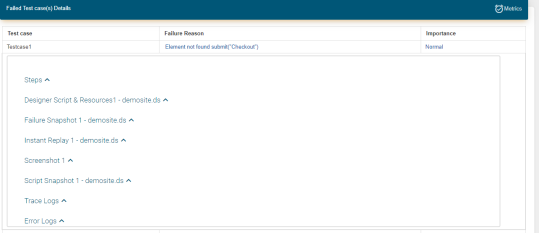
-
Each of the above details can be expanded to look into more details
-
The success test case will have the same details excluding the failed screen-shots and failed error logs
-
Previous 5 Execution Pass or Fail - This will give details about a test case consistency over the last 5 executions
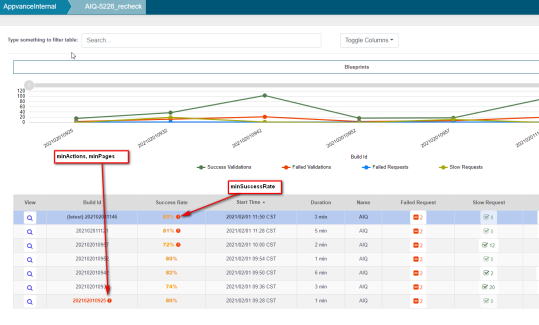
Min Actions and Min Pages:
This is an optional field, but if you want to enable it on the dashboards, you should make the following changes.
Based on the entries from the user, min pages, and min actions, the build would be marked as success or failure.
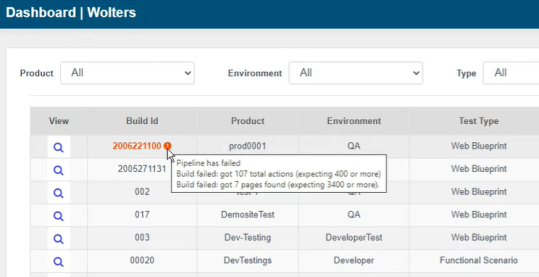
In order to have these changes on dashboards, please modify the build.xml as follows:
All these parameters are required in order to fully display this feature.
<property name="minSuccessRate" value="95" /> //minSuccessRate to skip set to “0“ zero
<property name="minActions" value="40" /> // set the minimum expected actions in the blueprint, minActions to skip set to -1
<property name="minPages" value="30" /> // set the minimum expected pages in the blueprint, minPages to skip set to -1
This would be used in the below ant tags.
-
createBlueprint
-
consumeBlueprint
-
checkBlueprintResults