Before you can even start to configure the AppDynamics monitor in AIQ, you need to make sure that your AppDynamics collector agent is running in the desired server where your target monitor resources are located, make sure that your collector agent is up and running, and that it is actually reporting data to AppDynamics Controller, if you cannot see any data at your Controller then you won’t get any metrics from AIQ either.
Here’s an example of how should look like a Controller retrieving data from its respective agent collector:
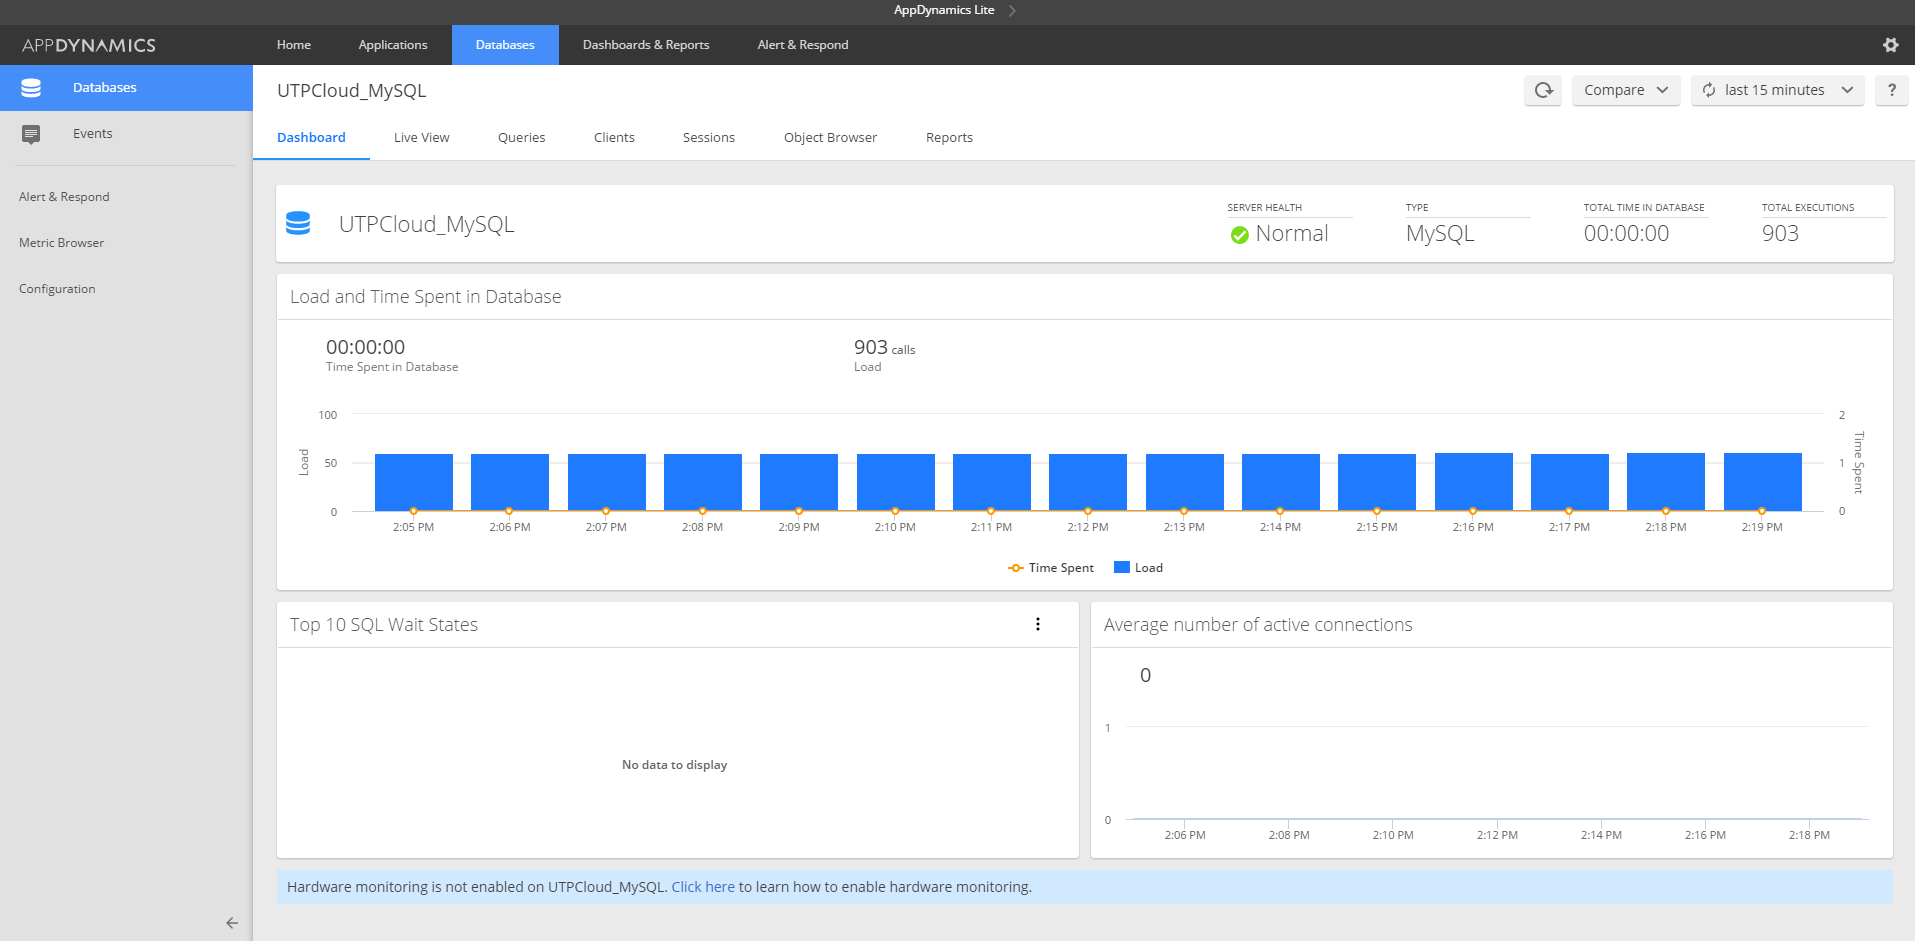
Once you’ve made sure that your AppDynamics Controller is reflecting data, you can proceed to add the AppDynamics monitor into AIQ. Now, the first things you need to have handy are your AppDynamics log-in credentials and your controller URL. It’s important to know that your AppDynamics Controller must be available through a public access server, meaning that the server where your controller is located must be visible through the web so AIQ can be able to access it or in the same machine as AIQ is. (If you’re using a Controller web page provided by AppDynamics then is already accessible and ready to listen for AIQ requests).
AIQ will require the following settings to connect with AppDynamics:
-
Account name
-
User name
-
Password
-
Controller
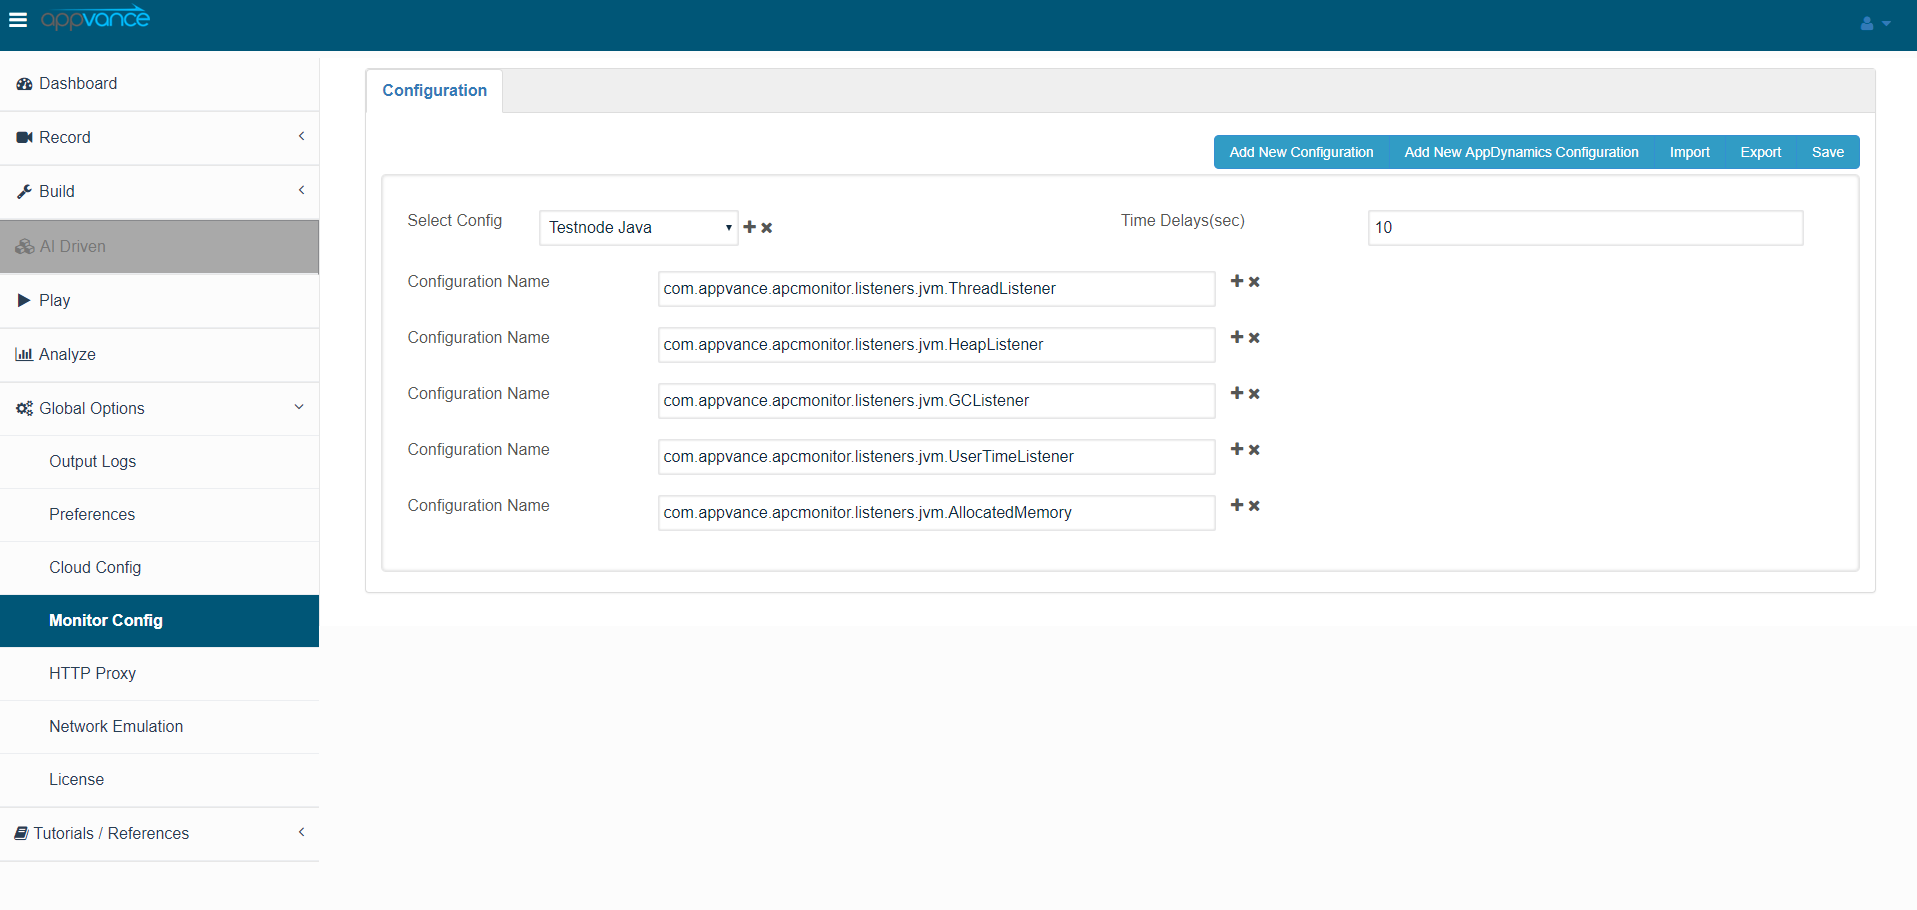
Navigate to the Options page from the AIQ Start screen.
Click the “Monitor Config” tab.
By default, there will be 2 configurations available.
-
PC
-
TestNode Java
Selecting any of the above will display all the configuration details like the configuration name, Time Delays and Property Names.
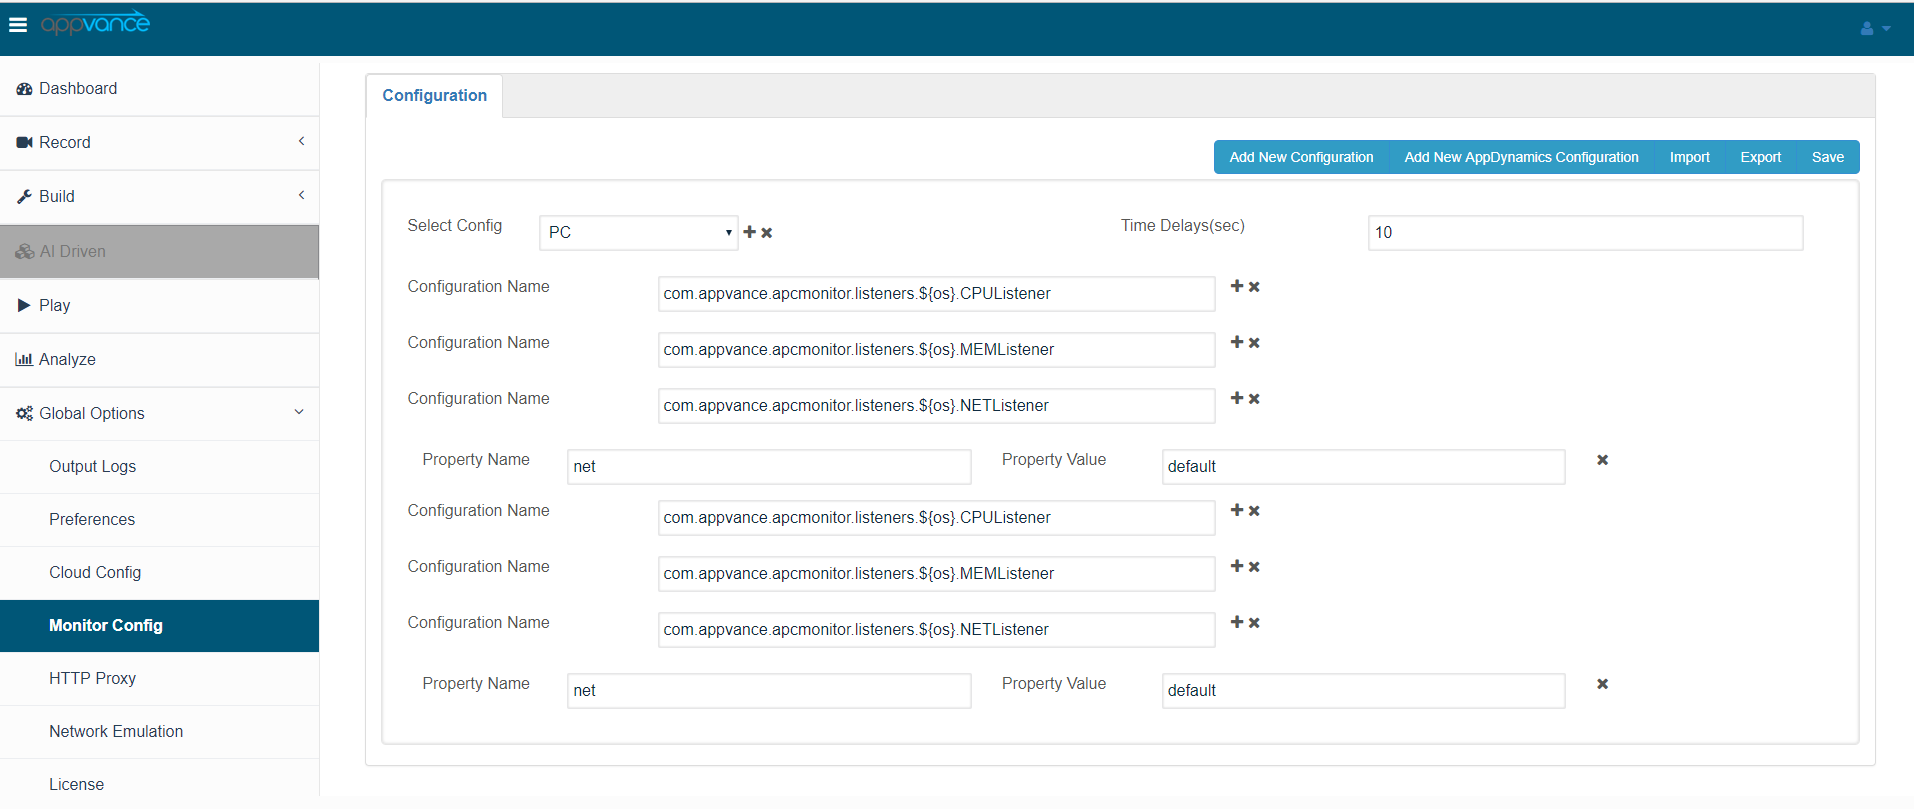
Users can add as many Configuration Names as required and are available, users should be aware of different listeners to add all the new configurations.
At the same time, users can remove the configuration names by using the X symbol available next to each of those.
TestNode Java Configuration
All these will be displayed in the monitor report from the report page. (Will be discussed later)
Adding AppDynamics Configuration:
-
Click the + symbol available next to the list of available configurations, this will be used to create a new configuration

-
Provide a valid name for the Configuration Name: Example “AppDynamics” and click Add config button

-
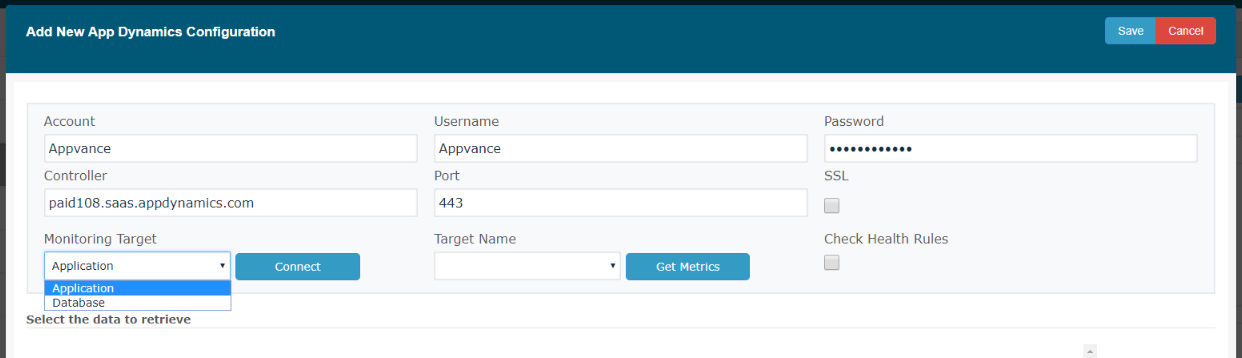
Click the “Add New AppDynamics Configuration” button which will open a new wizard as shown in the below screenshot

-
Add all the required configuration properties for AppDynamics


-
Providing all these required values and clicking on Connect will pull all the Applications or the Databases based on the selection

-
Clicking on Get Metrics will get all the properties related to that application and the user can select the data from the list to retrieve which in turn will be seen in Monitor reports


-
Users can select the required Data from the populated list and Click Save. The metrics tree shall only have check-boxes for actual metrics (leaves), not folders. As seen in the below screen-shot, all the selected metrics will be populated with the property name and property value (This value can also be obtained from AppDynamics by right-clicking on any required data and copying the full path) – This can be used when we are manually adding any new configuration to the existing configuration.

-
Click Save to save the AppDynamics configuration.
Users can also Export the saved configuration by clicking on the Export button, Configuration will be exported and saved to your local machine which can be used later by using the Import function to import back the saved config settings.


Running Scenario from IQ
-
To monitor a remote machine user should add "/APCMonitor" at the end of the URL in the scenario builder. Below is the screenshot

-
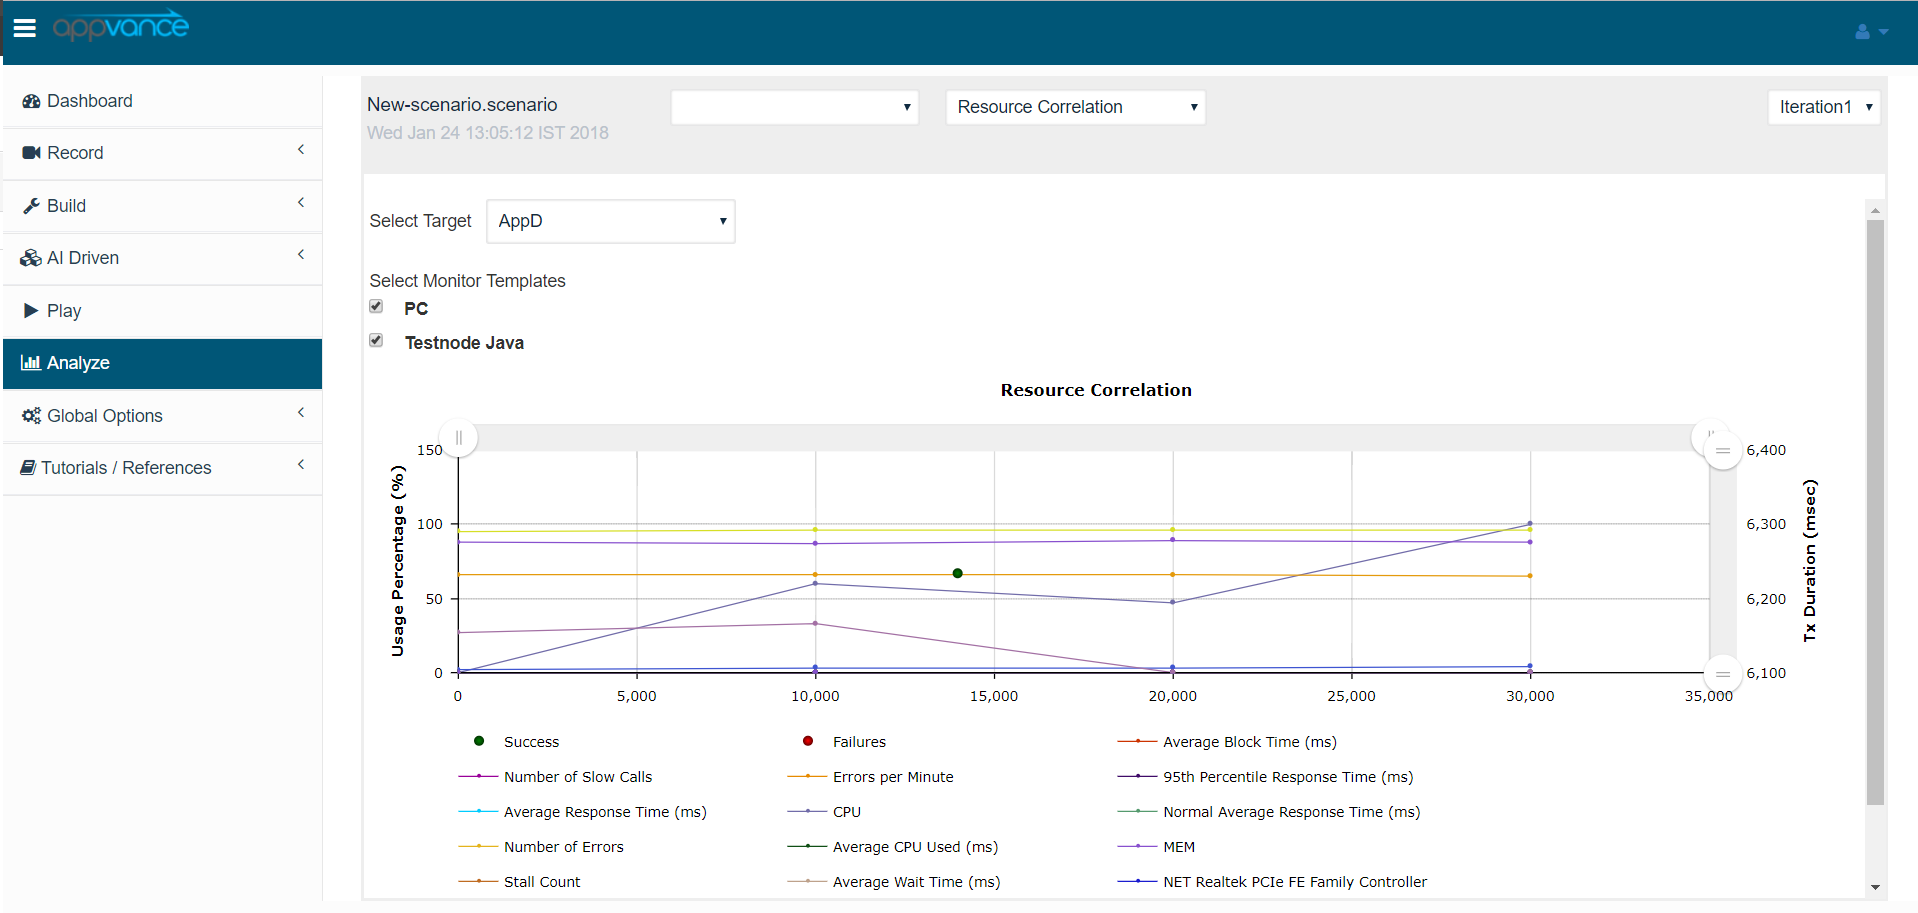
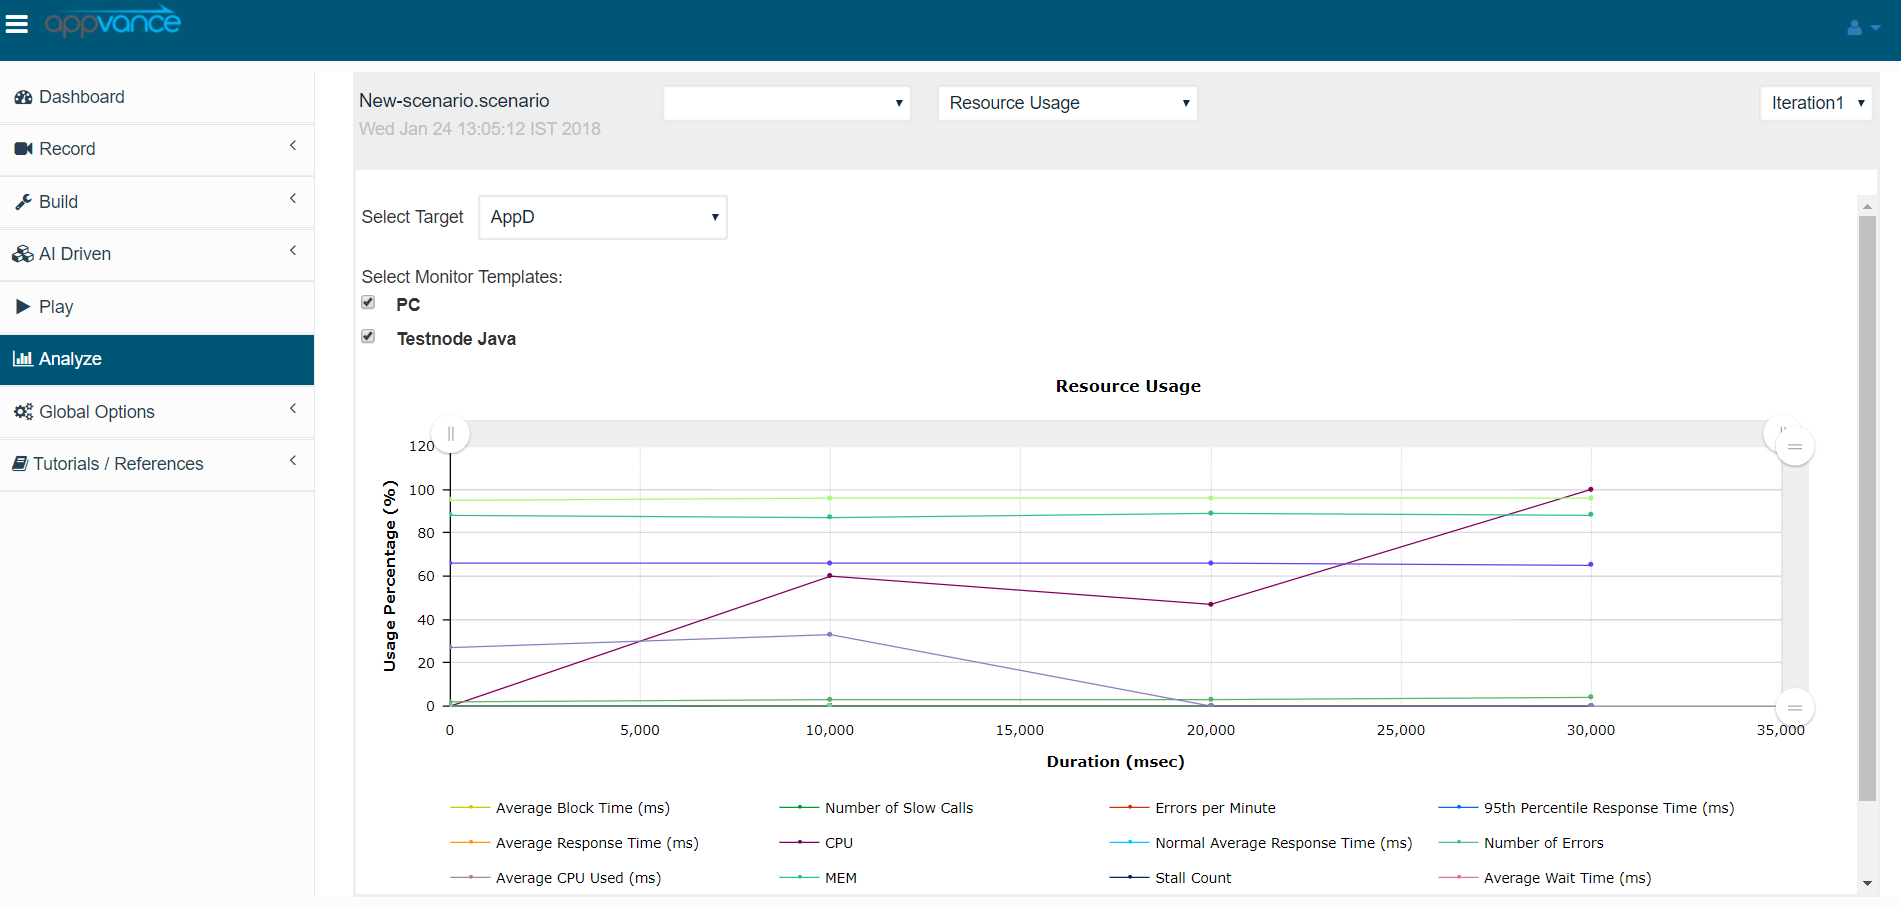
Running a Scenario after the configurations were added and saved successfully and navigating to the Reports page
-
Click Resource Usage, and all the configurations saved will be displayed here with the check-box, user can select different configurations based on the requirements