-
In addition to Appvance IQ monitoring and reporting, AIQ’s Dynatrace integration associates test executions with your Dynatrace dashboards and metrics.
-
Monitor tests in real-time from AIQ, and further investigate APM using links to any number of Dynatrace dashboards at a given point in time of a test.
-
Find the Root cause of performance bottlenecks faster using when drilling into Dynatrace from specific points in time from AIQ.
-
Determine performance problem solutions using the correlated drill down to Dynatrace dashboards and reports from simulated use of your application to CPU, Net, Memory, and DB Analysis.
-
For every transaction from Appvance IQ over some time, Dynatrace reports can be seen.
-
This is compatible with AIQ Scenarios running not only Test Designer scripts, but also Selenium, JMeter, Java, and many more AIQ-supported script types.
-
Access to the AIQ and Dynatrace reports is instant and live to help surface actionable performance issues.
Steps to Integrate with Appvance IQ
As mentioned earlier it is very easy and simple to Integrate Dynatrace in Appvance IQ.
-
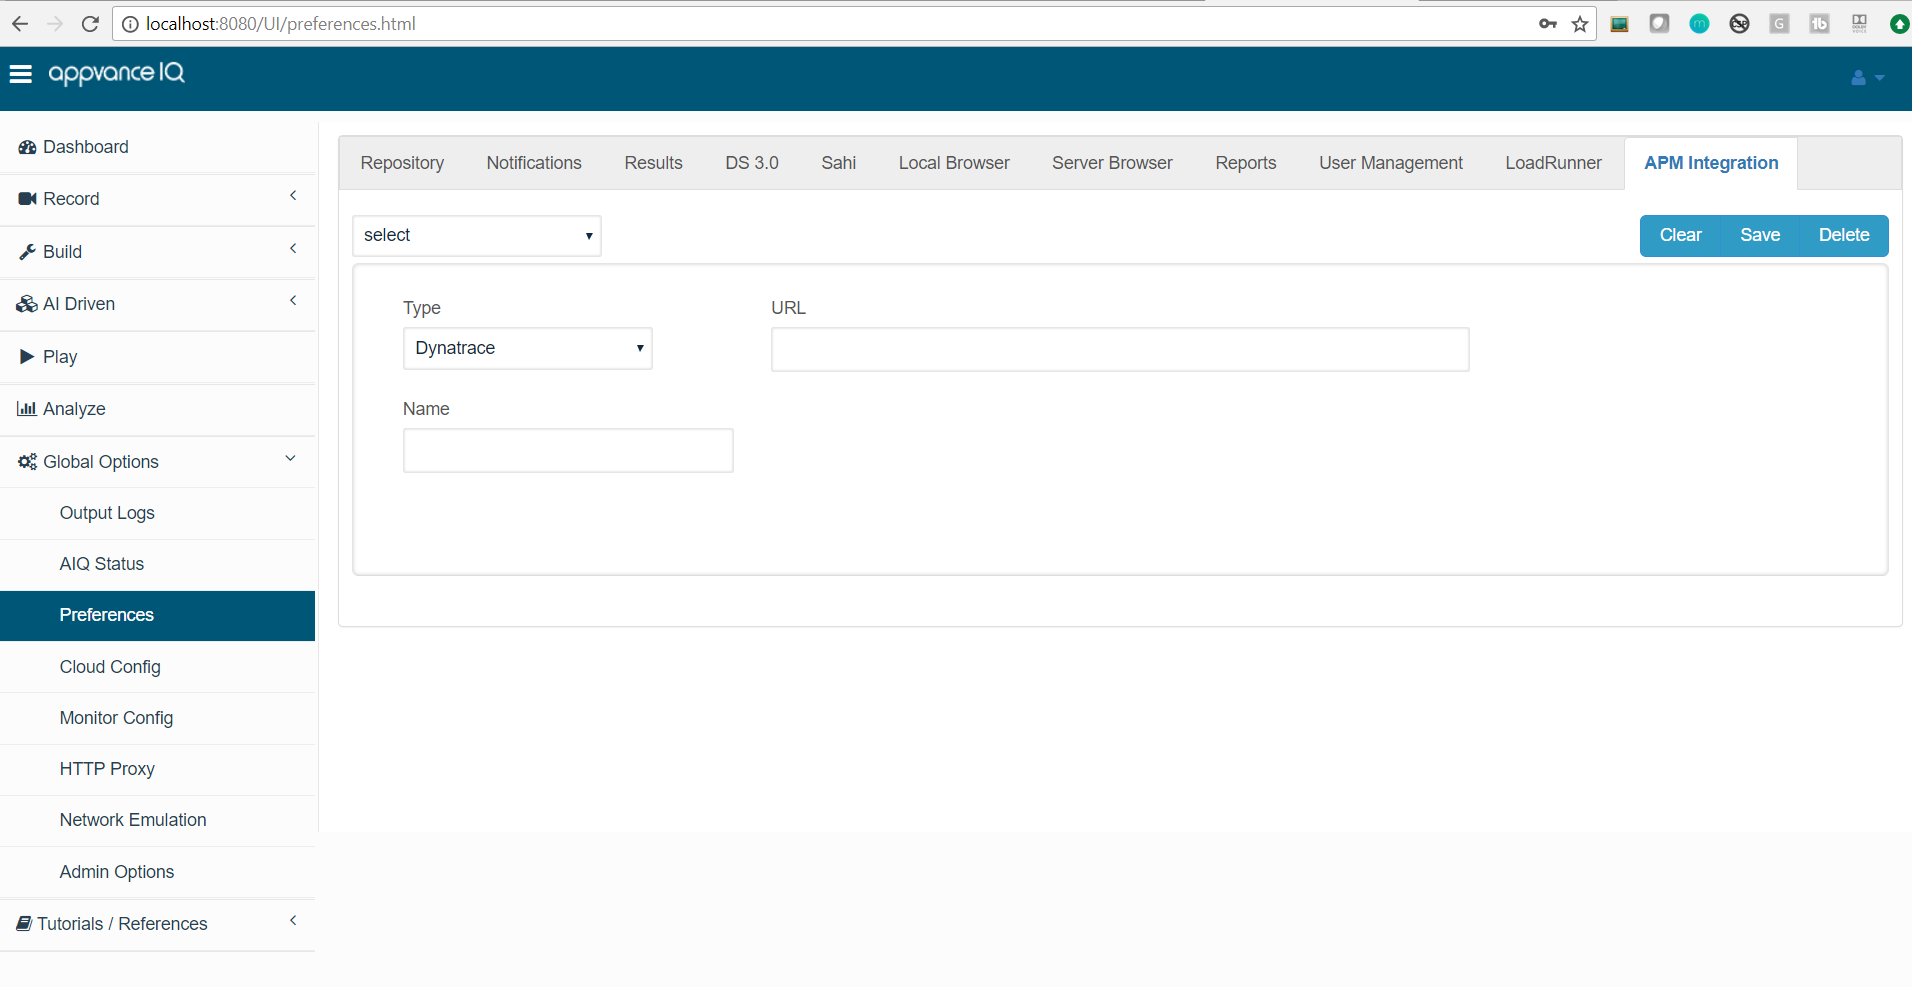
After logging in successfully go to Global Options.
-
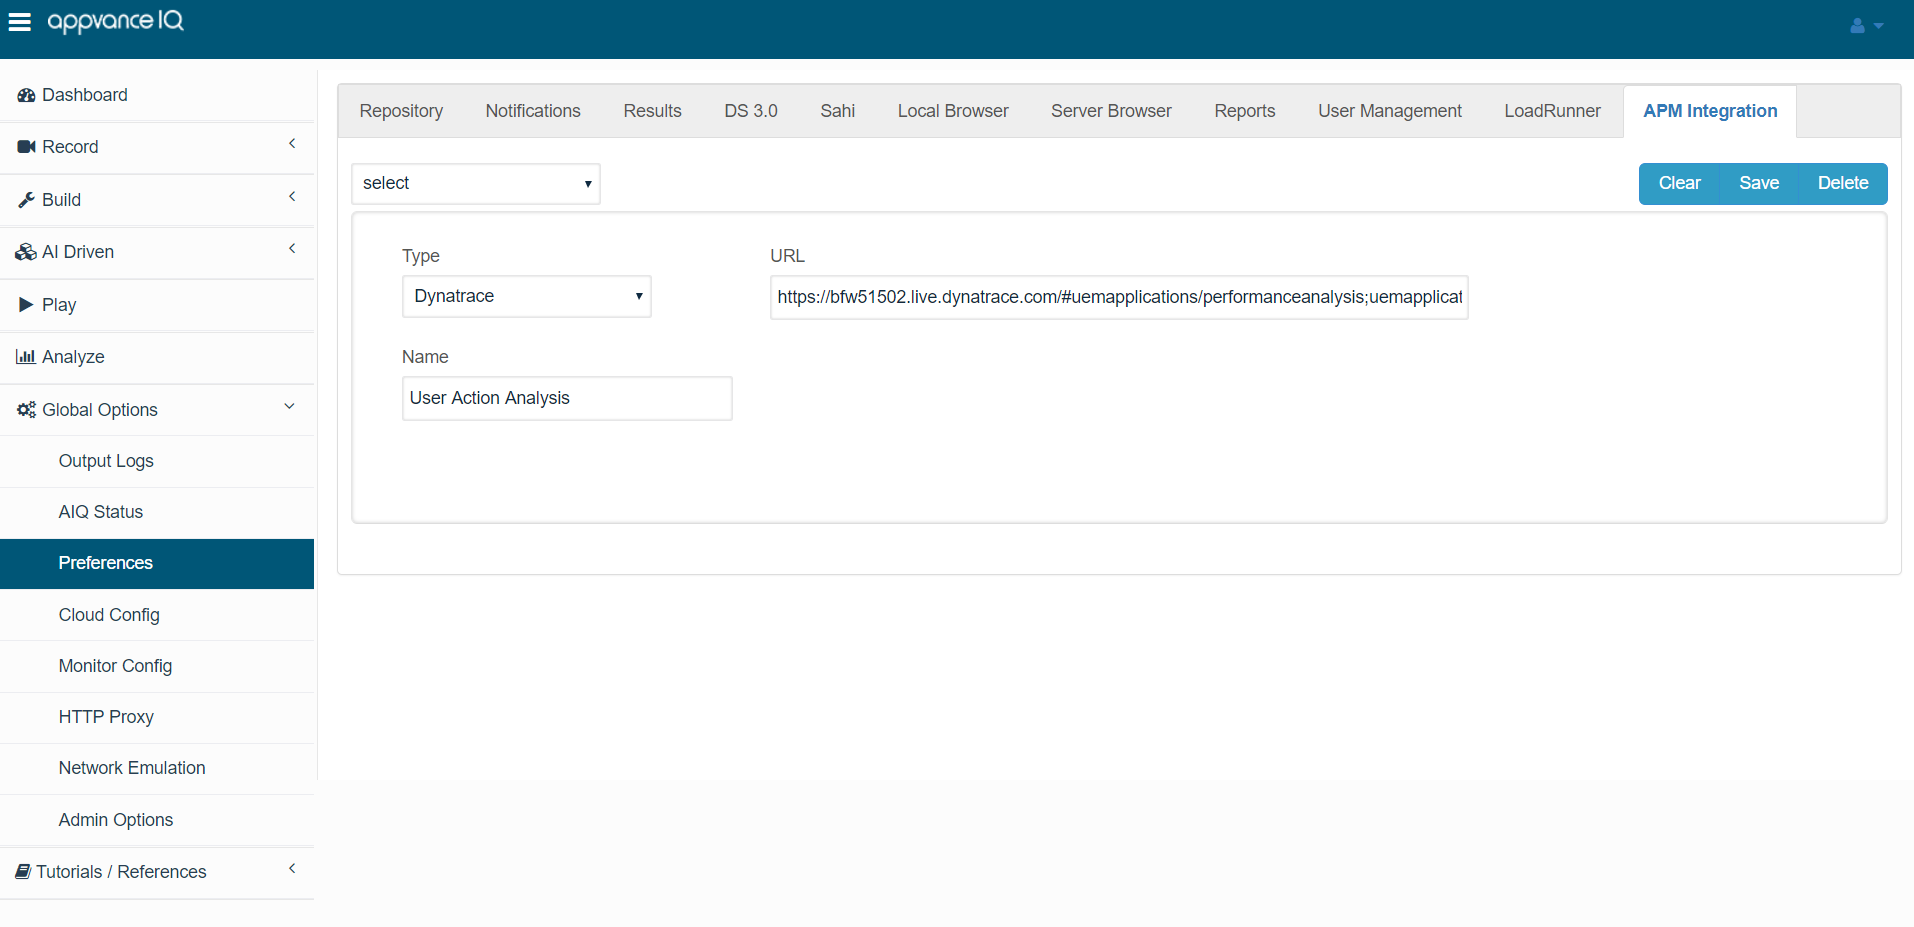
Under Preferences > Click 'APM Integration' > Under Type - Select 'Dynatrace'
-
You will notice the following options:
-
Type - Choose Dynatrace.
-
URL
-
Name
-
and buttons to Clear, Save and Delete.
Type: Is an option to select Dynatrace Integration.
URL: is to simply provide the dashboard URL from Dynatrace of what you are looking for, Simply copy-paste the dashboard or the report URL and paste it here.
Name: is a text field that you can use to provide meaningful names for your Reports, say if you are monitoring Memory or CPU or something particular, you can name those with a corresponding URL from Dynatrace.
-
-
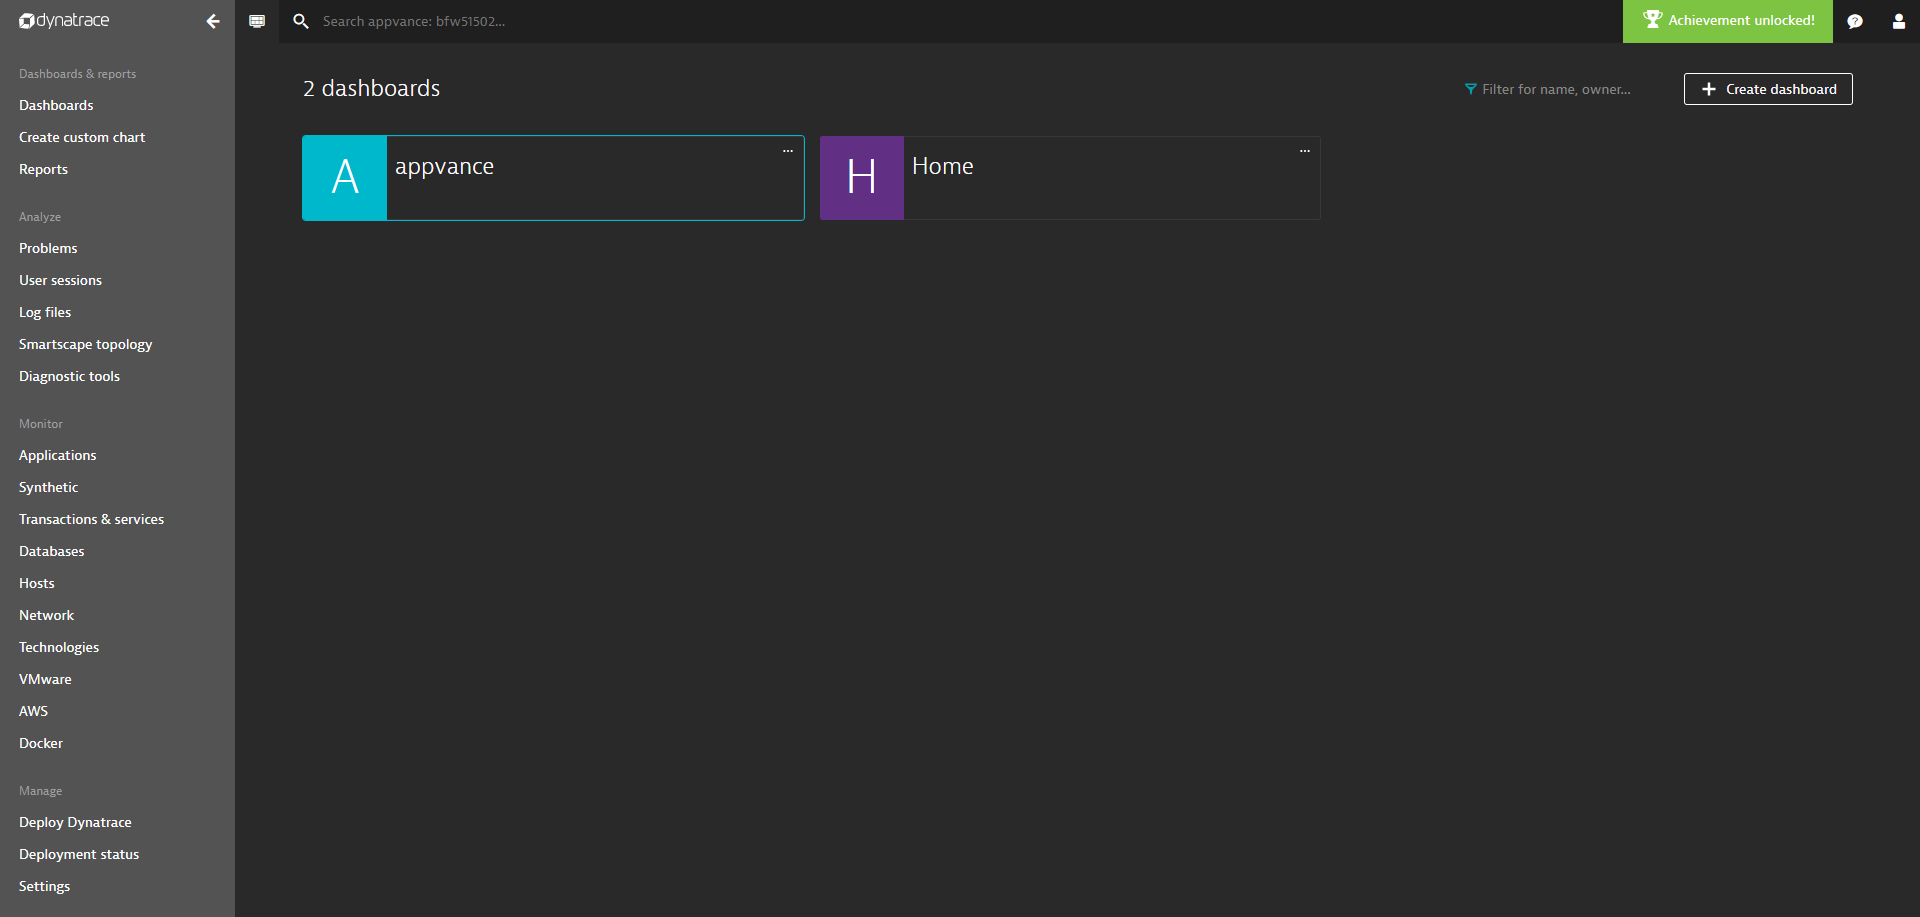
Log in to your Dynatrace account and choose an Application or a Server or a DB (that is already configured to have the Dynatrace agent installed) based on what needs to be monitored
-
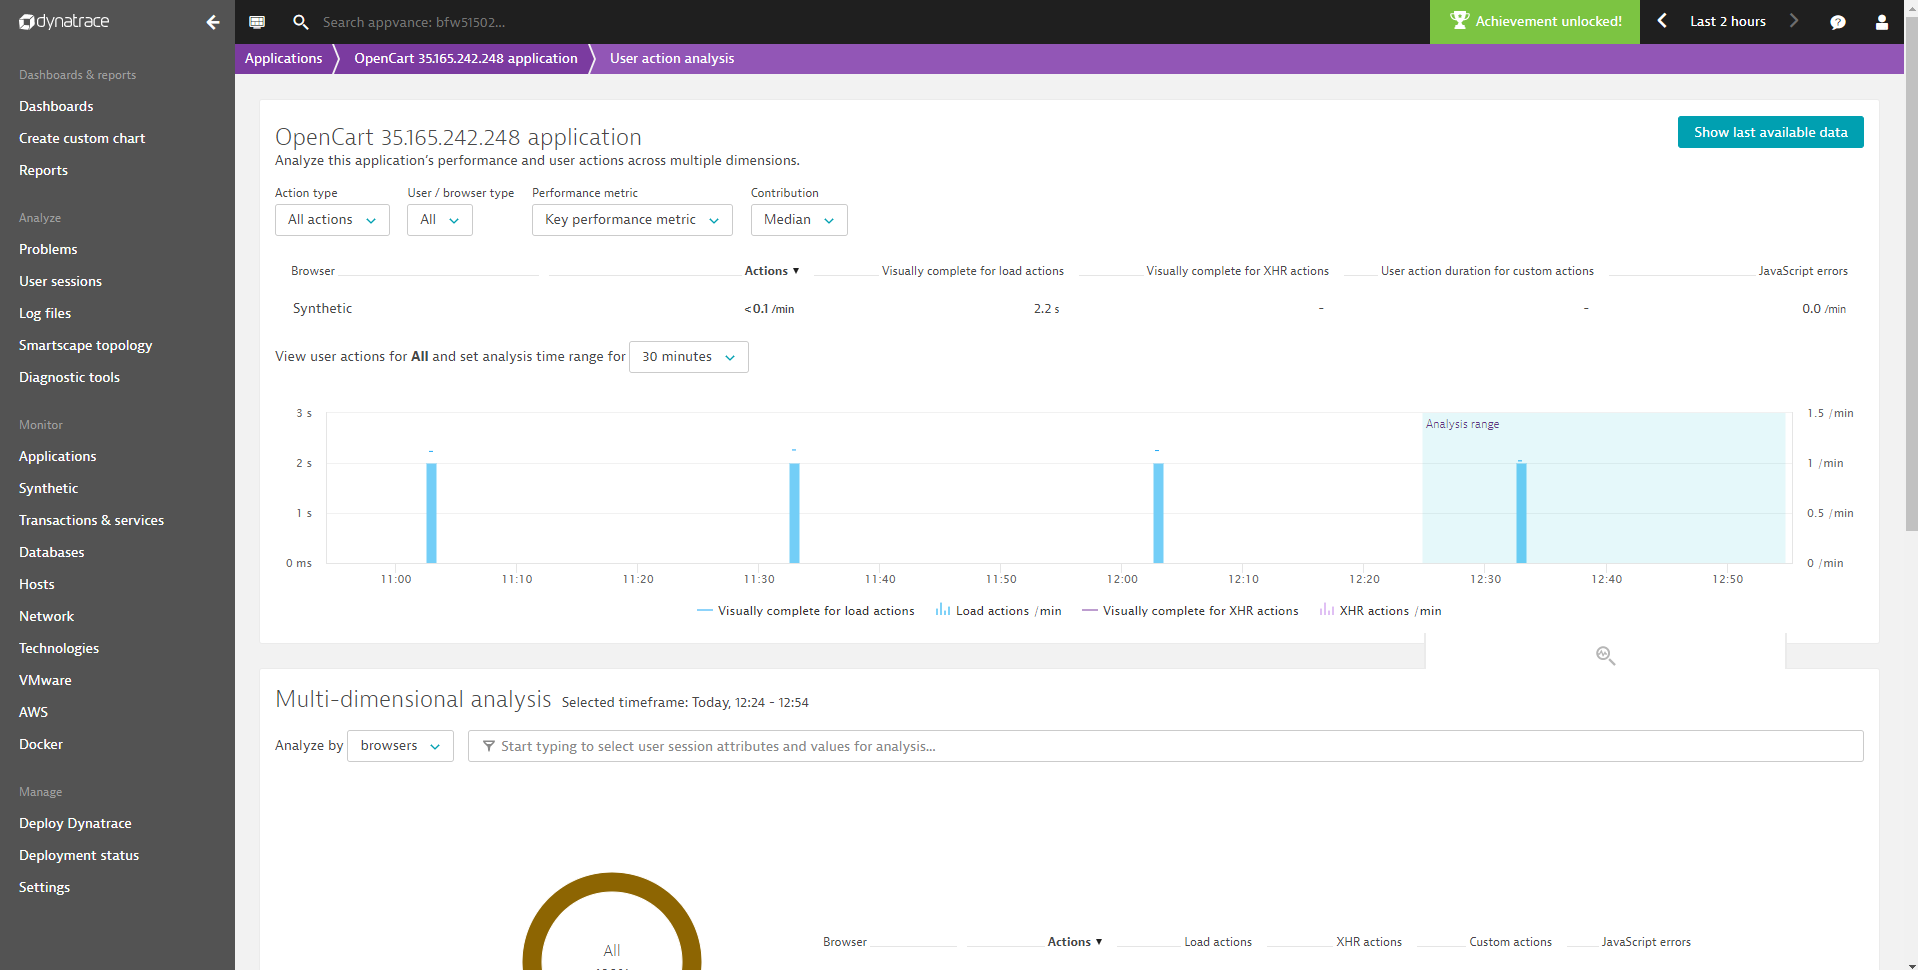
As seen in the below screenshot, the user action analysis of an application called 'OpenCart' is chosen, you can simply copy the URL from the address bar and paste it into the URL section of Dynatrace Integration and provide a meaningful name say 'User action analysis' and click Save
-
Below is the configuration made in Appvance IQ
-
Click Save
-
Once the configuration is saved, go to the Editor and create your performance test on the application, save and run the scenario
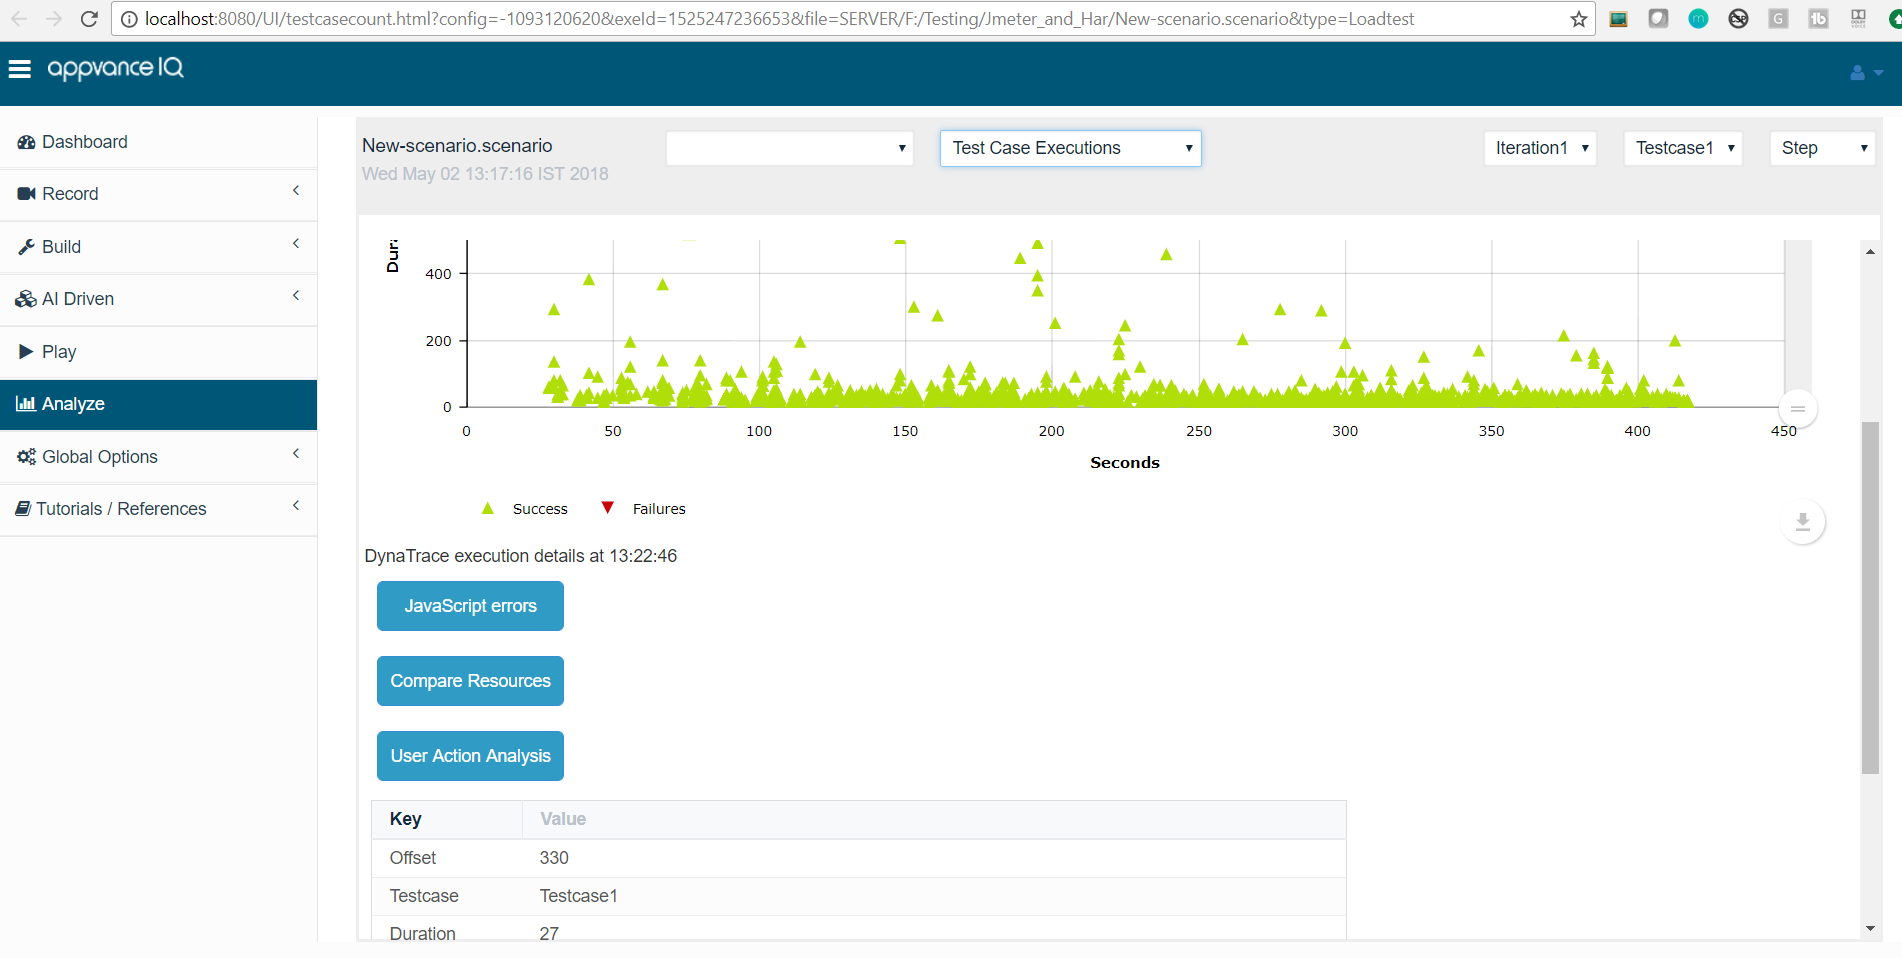
Note: No configuration changes are required in the Scenario Builder, it is required to save more percentage of logs in the Options panel of Scenario Builder so the Test case execution graph shows some data.
-
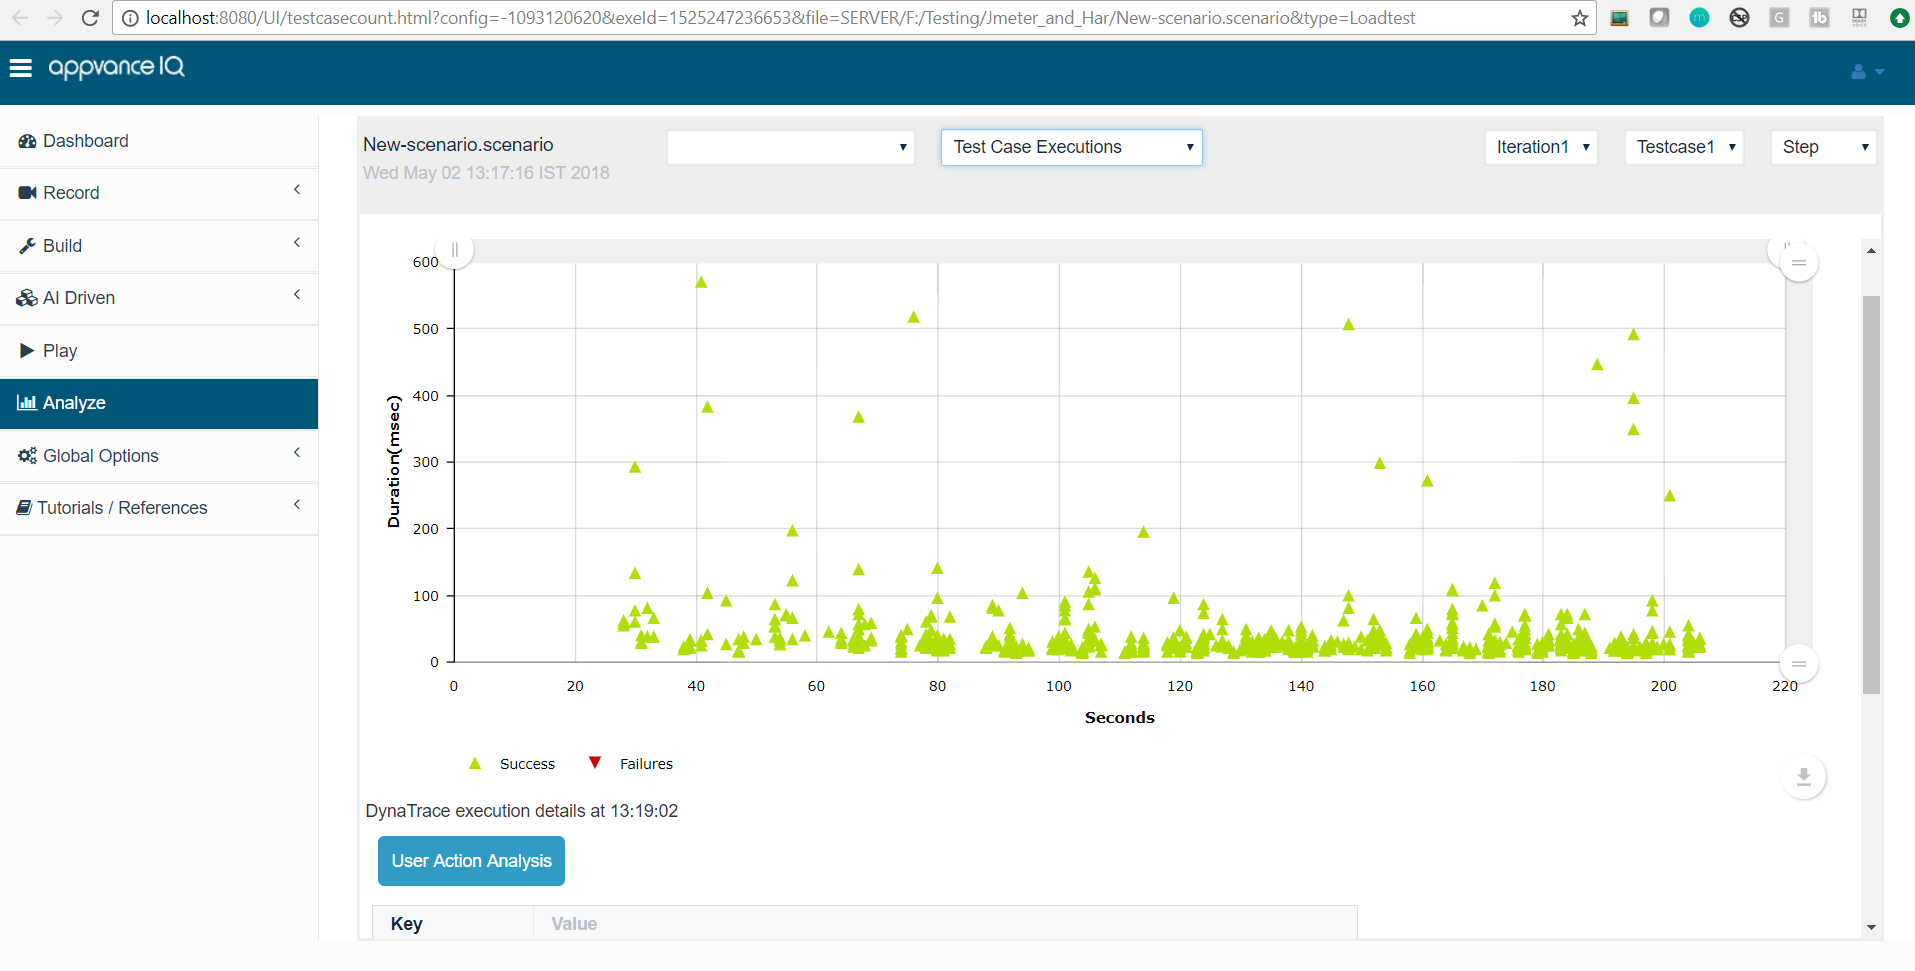
While the test is running (The reports shall be available during the test run and after the test is complete as well), on the Analyze page, click the Test Case Executions tab and you will notice a lot of executions that is happening for the performance test. Select Iteration and Test case from the drop-down.
-
Click any of these small triangles that are plotted over the period and these are the executions that happened
-
You will notice buttons (with what was configured at the global options for Dynatrace) at the bottom for each of these executions, you can simply click this button which will take you to the Dynatrace dashboard page now
-
Similarly, you can click any small triangle on this page and click the buttons to check the app performance over the period from Dynatrace
-
To add, any number of configurations or processes can be added to this list which shall be displayed on the same page