Instant Replay
How about Recording Network activity in the background while you are recording your UX test cases using Test Designer?
Test Designer Instant Replay is the answer. Yes, Test Designer Instant Replay can capture all your network activity while a use case is getting recorded in Test Designer and it can be exported as a .zip (with HAR and contents of the page), CSV file that has details of the method, port, vhost, uri, status and also as an executable JS fie.
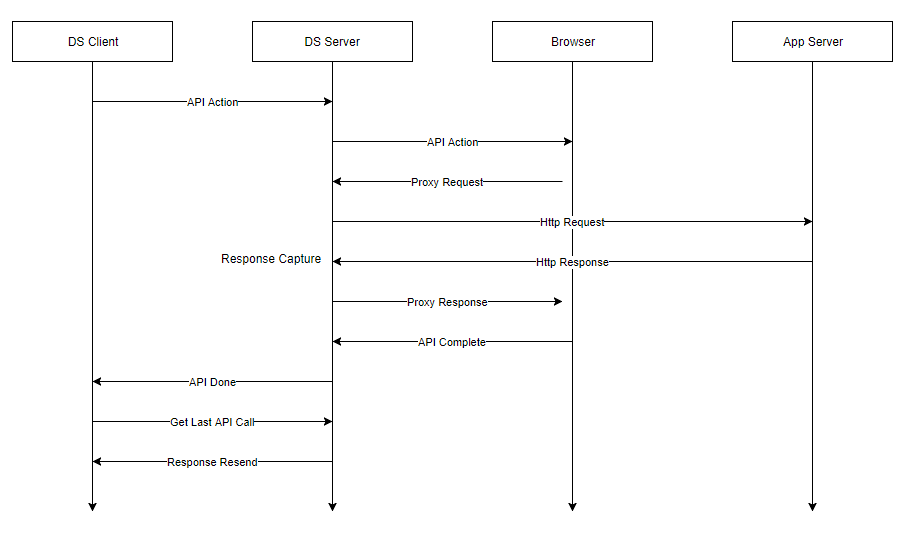
API Testing Process:
When an API request is done, Test Designer tells the browser to do the request, but it injects a header to capture and provide the API calls.
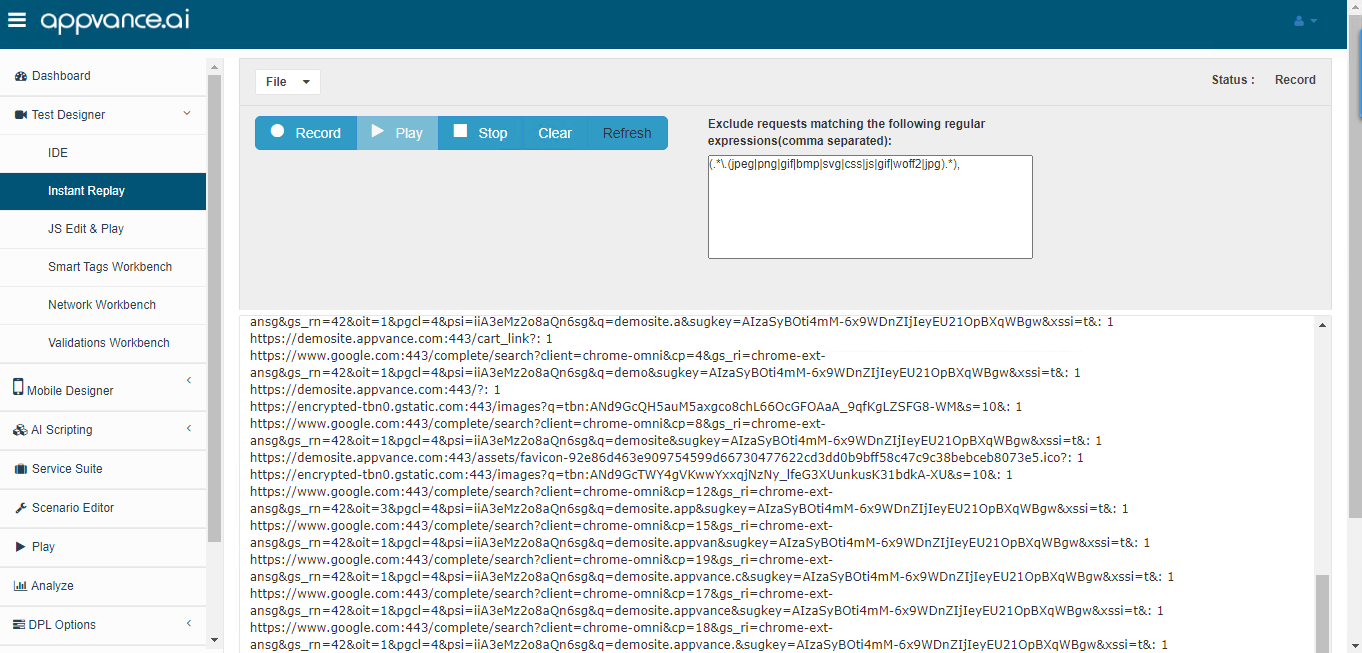
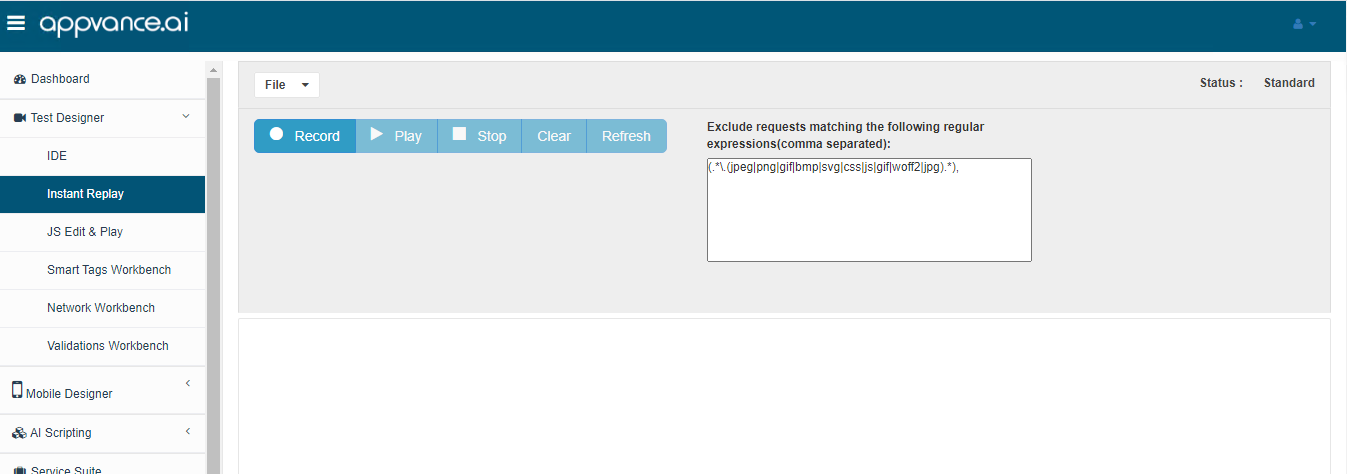
With the option, Exclude requests matching the following regular expressions(comma separated): with default values of (.*\.(jpeg|png|gif|bmp|svg|css|js|gif|woff2|jpg).*), will filter out all those files with the mentioned extensions, you can remove or add or make any changes to these extensions depending on the requirements.
Navigation:
From the dashboard page, Under Record, Click Test Designer Instant Replay.
File Menu:
-
Open: Only allows .zip files. When you save the file after having some traffic recorded, File > Saving will save the file with a .zip extension or when you do a File > Export to HAR, it will save with a .zip extension. File residing in the local machine can be opened using File > Open.
-
Save: Is used to save the file after changes or a new unsaved file.
-
Save As: Is used when you want to do a Save As of an already opened file with a different file name.
-
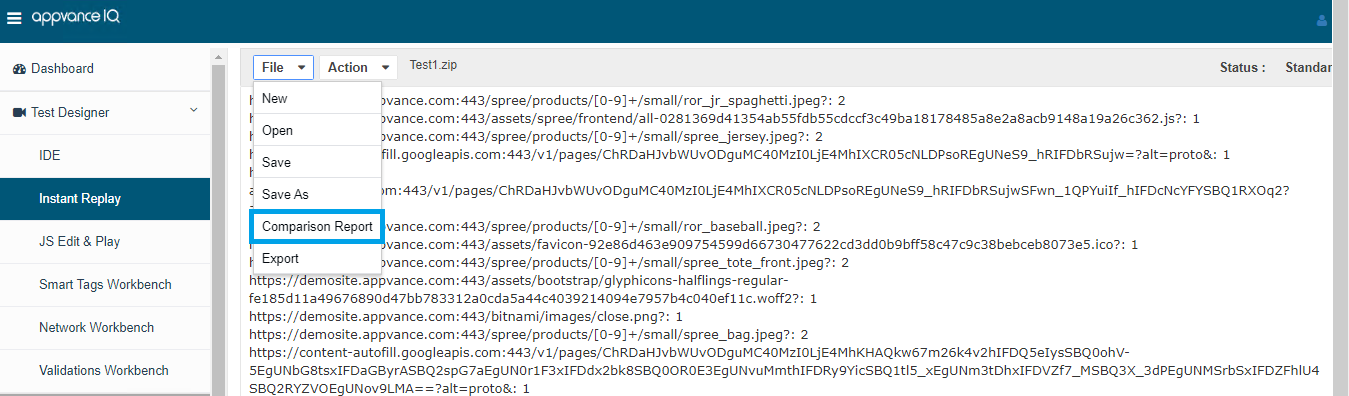
Comparison Report: Two Instant replay zip files can be compared to check the differences between the Response body, Headers, Payloads.
Typically used for the same type of flows, with different login details, or with different environments to check the differences between Response bodies, headers, or payloads.
-
Export :
Comparison Reports
To generate the comparison report, you first need to load the open the instant replay file to compare against baseline data by making use of File > Open and open the zip file that is saved as the instant replay of the script.

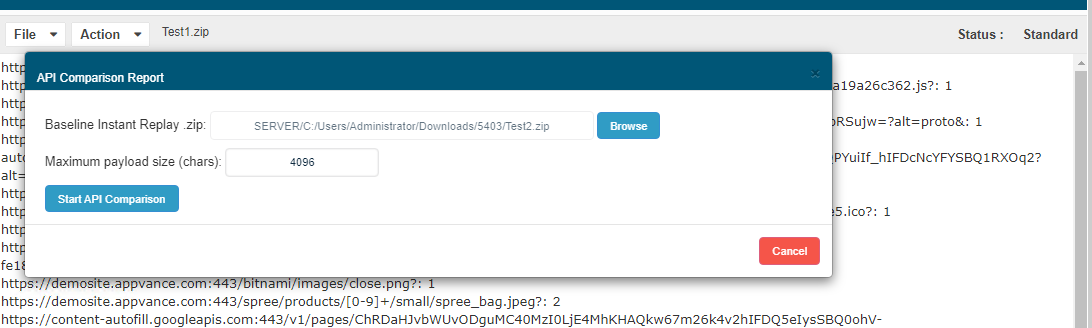
Click File and choose Comparison Report from the Drop-down.
API Comparison pop-up would be displayed to choose the baseline data to file Instant Replay (.zip file) with the Browse button.
Maximum payload size (chars): would default to 4096 chars but that is something that can be changed and allows only numerical entries.
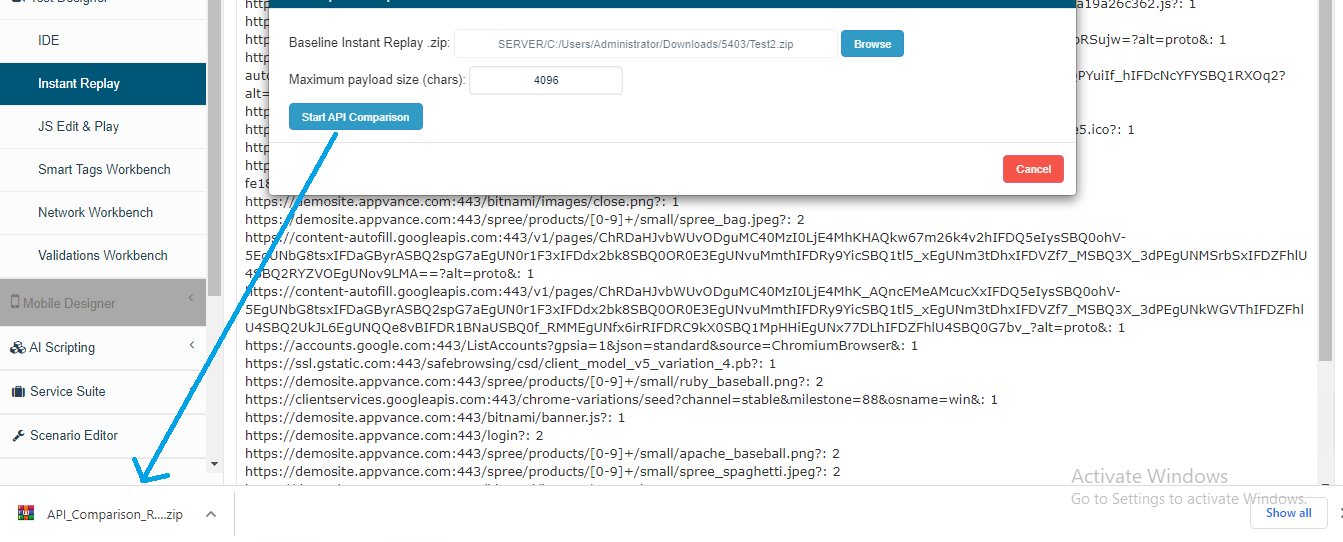
Start Comparison button would be enabled, clicking which will download a zip containing all the reports.
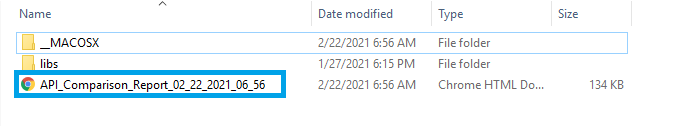
It is required to extract the downloaded zip content of the files and open the generated .html file.
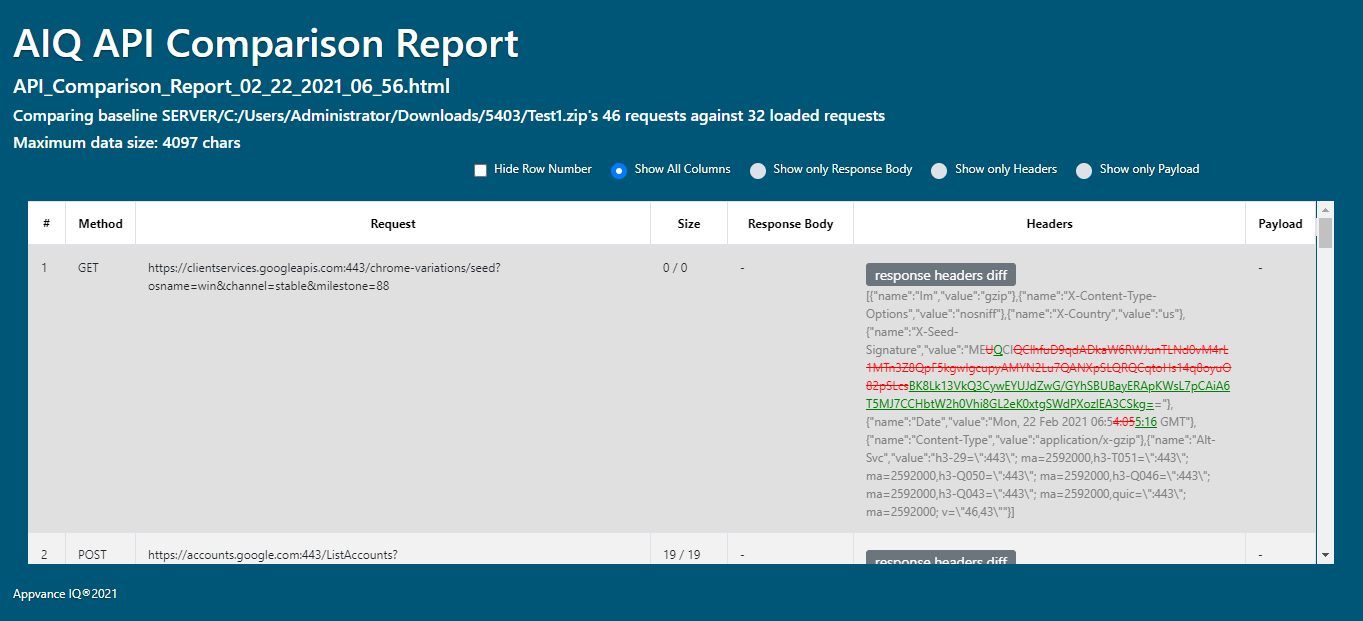
Below is the comparison report that is going to be generated, which will show the comparison report file name, the files that are used for comparison, and the maximum data size.
It displays all the Requests along with the size, Response Body and the differences for each of the rows which can be expanded/collapsed, Headers and request/response header differences which can be expanded/collapses for each of the rows, Payload with differences for each of the rows which can be expanded/collapsed.
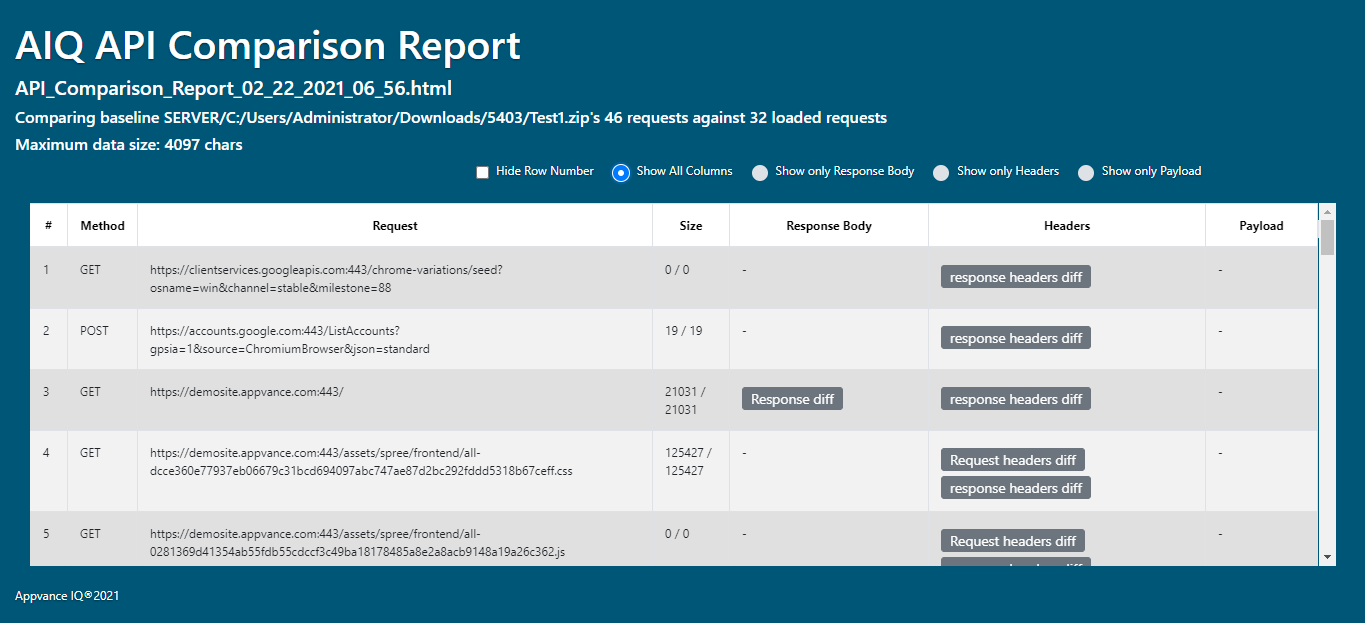
There is an option to hide or show the row numbers.
Also, the option to choose a particular column that needs to be displayed.
You can click each of the buttons like "response headers diff" for example to check the differences.
-
"-" means no data found
-
The green color means some data has been added
-
The red color means some data has been removed or not found
6. Export: The recorded traffic can be exported to 3 different formats.
a) HAR: downloaded as a .zip file, contains the har calls "Record.har" plus all the history containing .jpg's, .html's, txt's, .dat's, .json files etc
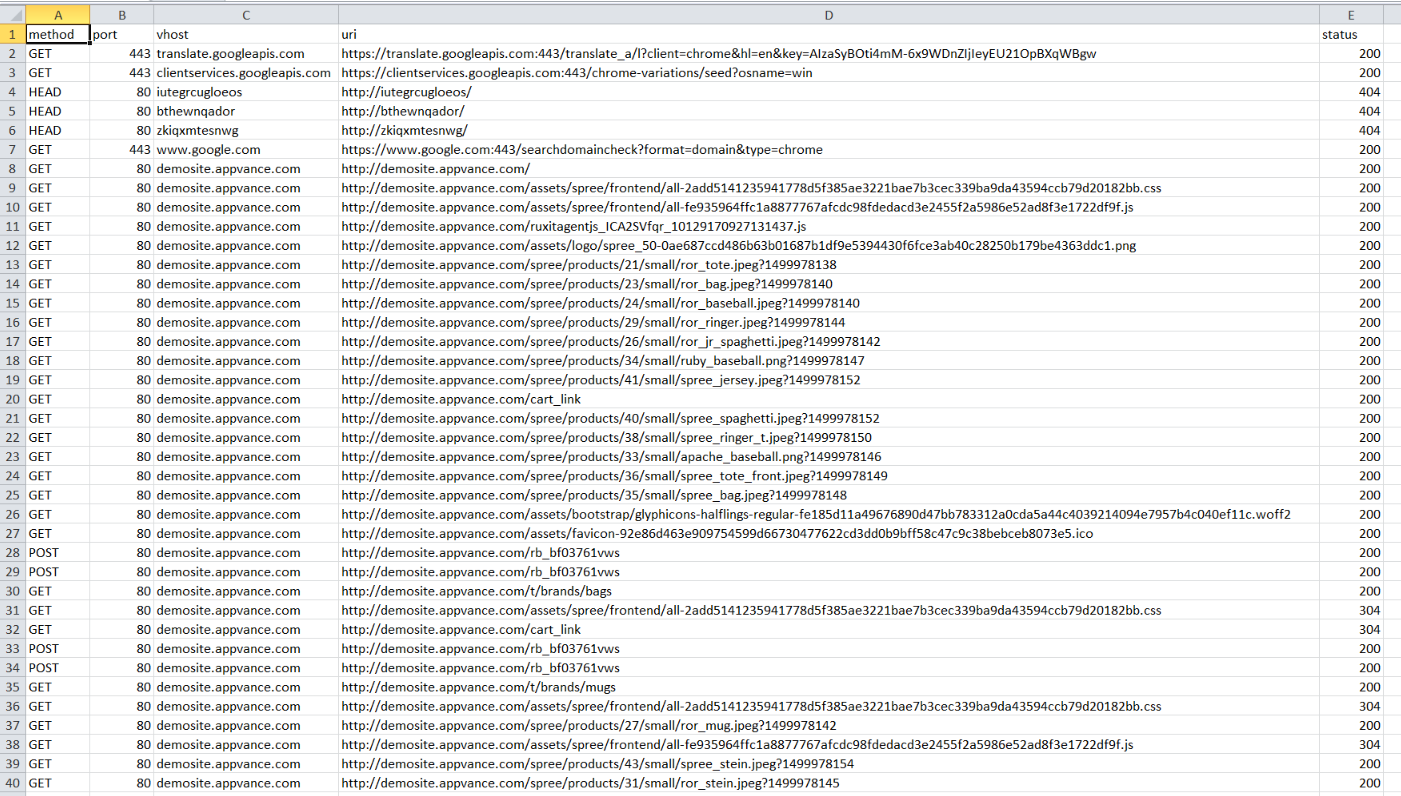
b) CSV: Contains details of the method, port, vhost, uri, status. This CSV can be used as a log from Appvance AI as well
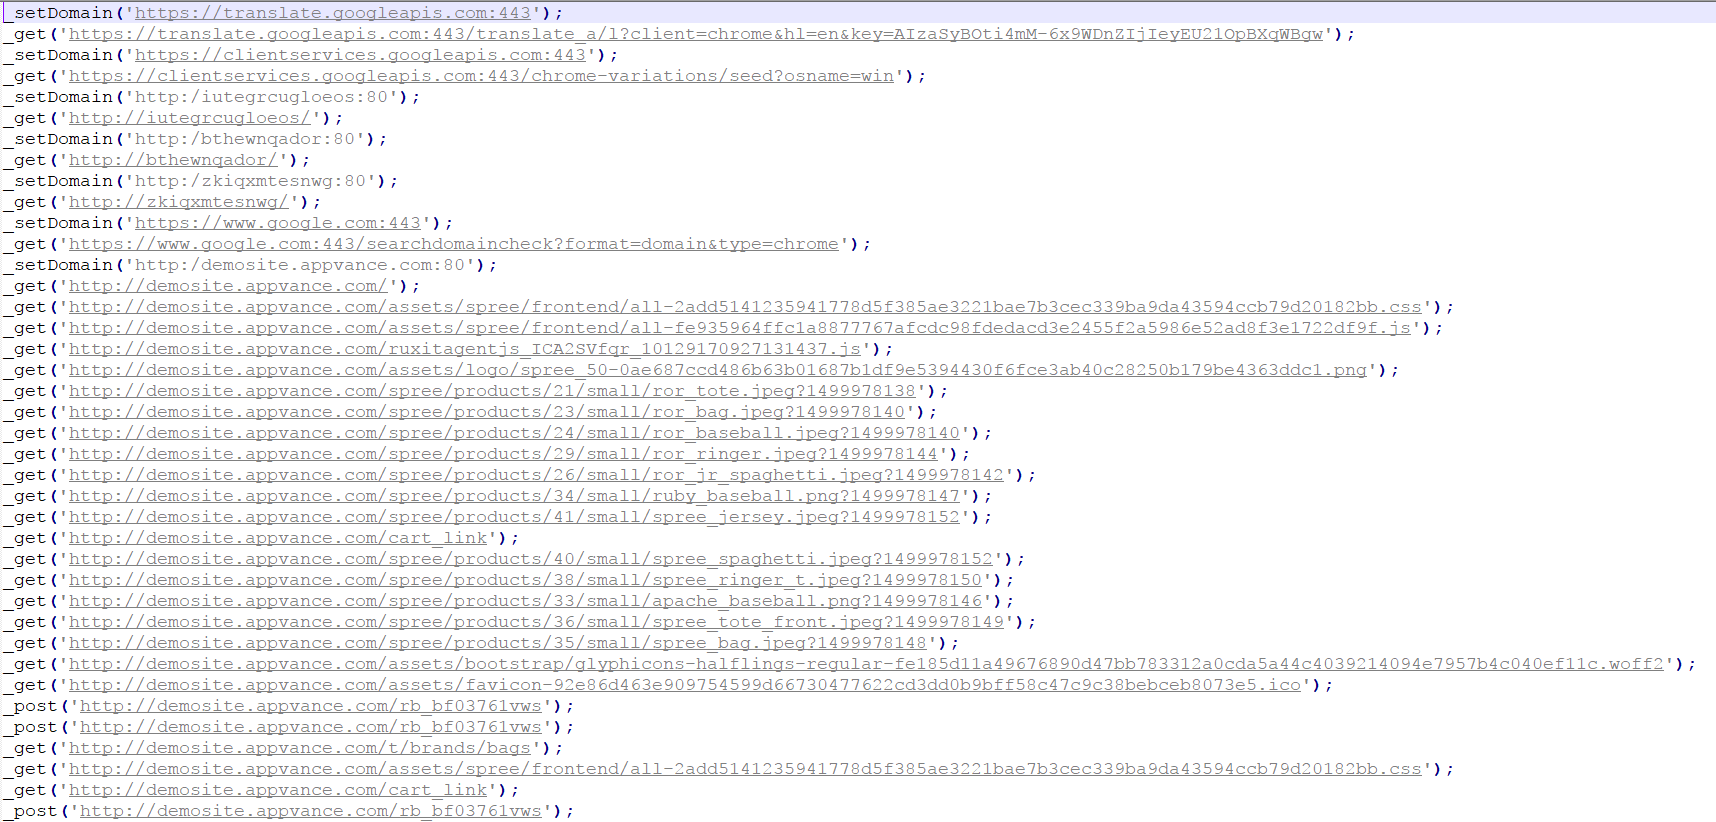
c) JS: A executable JS Script with all the gets and posts like the one below
Actions Menu:
-
Start Recording: will start recording HAR traffic for the app that will be recorded using Test Designer IDE.
-
Re/Start Playback: will clear the historical data which is already present and make a fresh recording of the requirement for playback.
-
Stop: will stop recording HAR traffic calls.
-
Clear History: will simply clear your recording area and it will be ready to record new HAR traffic.
-
Show calls: This is more like a refresh button, that keeps updating the new traffic that got recorded.
Status:
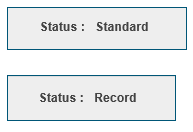
You will see Status on the top right corner of the page, Initially Status will be Standard.
When you click Start Recording from the Action menu bar Status will change to Record, and Again, Status will be Standard when you click Stop from the Action menu bar.
How to use Test Designer Instant Replay
Follow these steps:
-
Go to Instant Replay and click Start Recording from the drop-down.
-
Go back to Test Designer IDE and begin Recording by clicking Record > choose a browser and perform your UX actions.
-
Come back to Instant Replay and click Show calls from the Action Menu, you will notice all the traffic that is getting captured.
-
Once done with all the recording, you can go ahead and save the file as a .zip file or any other 2 formats mentioned above.
-
Not just recording, Test Designer Instant Replay also records the history calls when we playback scripts from Test Designer.
-
Go back to Test Designer IDE, open any existing script, come to Instant Replay, click 'Start Recording' and playback the script from Test Designer IDE, and you can click 'Show calls' from the Action menu, you will notice all the traffic that it got created.
-
These traffic logs can be used to generate more traffic when running as a performance test (running at the protocol level) using along with the actual Test Designer script (running at the browser level).