The middle section is called the Test Designer grid where it displays steps recorded with Actions, Accessor, Value, and a Description of each step.
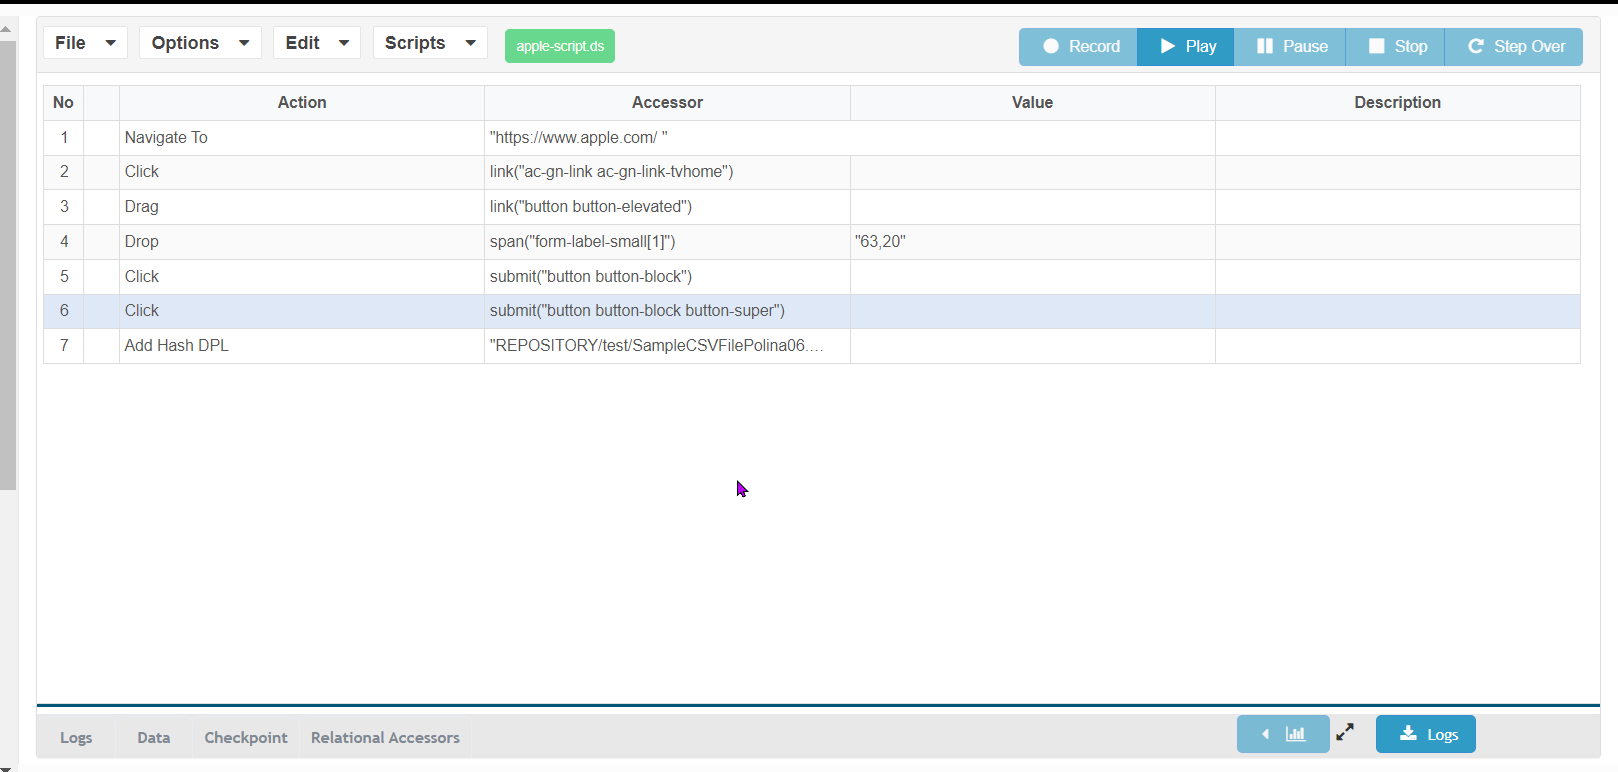
No: Displays the step numbers.
The empty column next to No is used to set breakpoints which will be covered in the "How to debug" section.
Action: This shows the different actions that are being recorded, You can double click the cell and change the Action from the list of all the accessors available.
Accessor: Accessor that the Test Designer best identifies for an element of the page will be displayed, Again this is a drop-down with other options accessors to choose from. It is also a text field where you can add a new accessor if required or an accessor can be modified or edited.
Value: The value column shows the values that are mostly used when setting input fields on the page, this value can also be data-enabled which will be discussed in later sections.
Description: Users can add a custom name to each step which in turn will be seen in all the reports.
Using the Test Designer
Recording a New Script in the Test Designer
-
Go to Test Designer IDE
-
Click File > New
-
Click Record and Choose the browser from the list of available browsers from the drop-down
-
You will notice the "page is not ready to record" notification next to the record button, Please wait until it changes to "Recording" mode.
-
Once the mode changes to "Recording", you can provide the App URL under test in the browser address bar and start recording subsequent actions.
-
While recording subsequent actions, you will notice the modes of "Please wait" and "Recording", it is recommended to record your flows when the status is "Recording" else your actions shall not be recorded.
-
Click the Stop button to stop your recording.

-
You can save the script using the File > Save menu and provide a name for your use case.
How to add a new step without having to start recording
Use the Edit options to choose Add First Empty Step to create a first empty step without having to record anything, this might be useful to create our step like using Add SmartTag file, Add Network file, or by using Include API to add other scripts.

This option will not be shown after adding the first step.
You can also use right-click context menu by right-clicking on the IDE which will have the option Add First Empty Step, clicking which will add a new empty step for editing.
How to Enable Scripts in the Test Designer
-
Record a new script or open a script that is already recorded using File > Open
-
Create a comma-separated CSV file with the data, use your favorite editor like notepad++, the file extension should be .csv

-
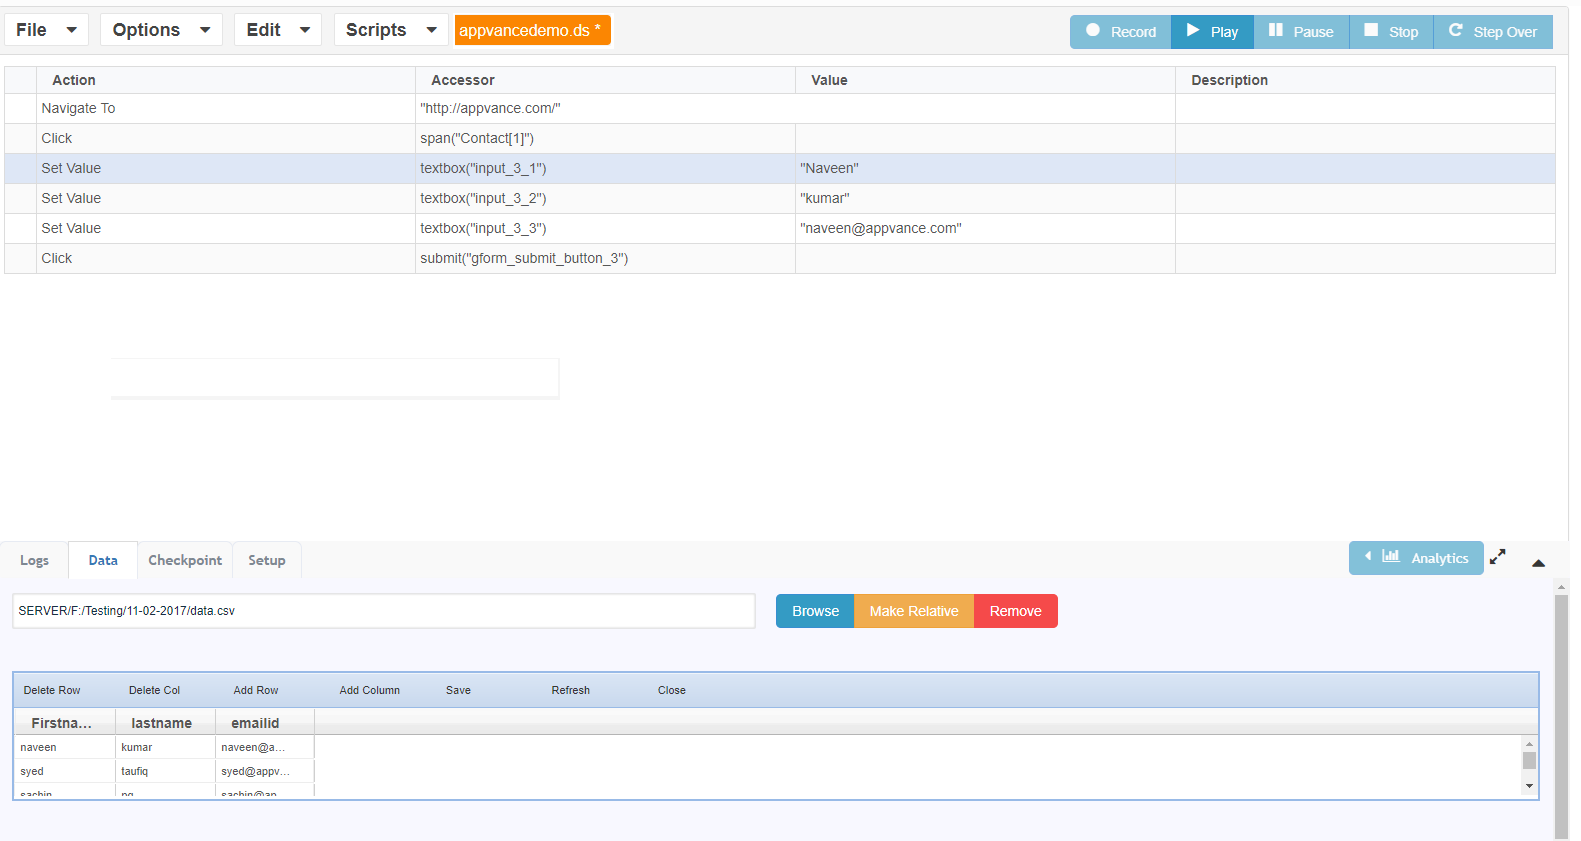
In the Test Designer IDE, go to the Data tab at the bottom panel
-
Click Browse and open the .csv file that is created in the above steps
-
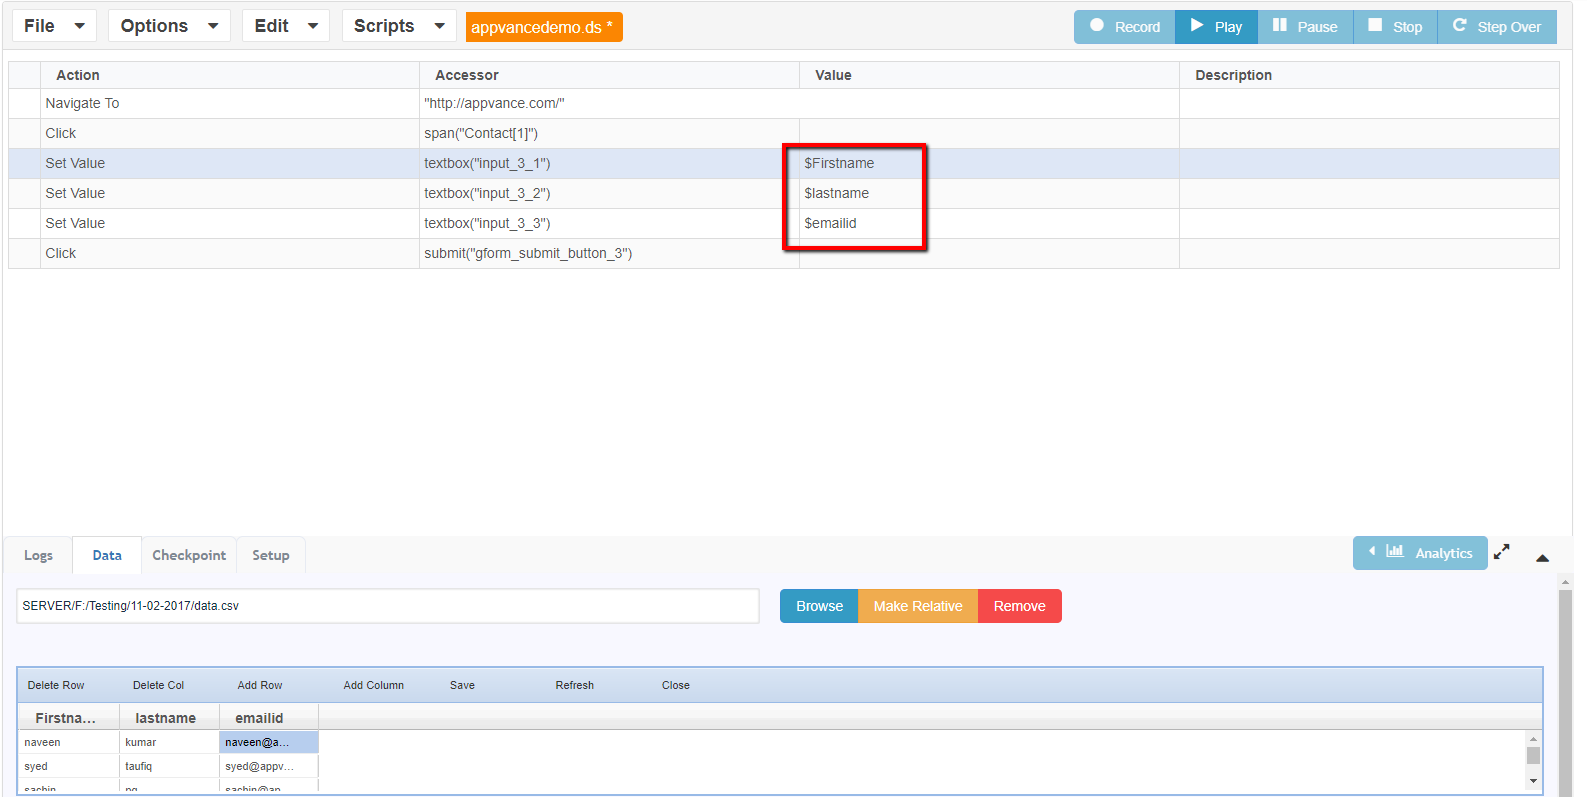
Drag the value from one of the columns and drop it in the value column of Test Designer IDE where ever desired. Say for example on the application you have a username and password that needs to be data-enabled and your CSV file contains columns that say "username", "password", drag a value from the username column and drop it in the value field of Test Designer IDE corresponding to username row and similarly for the password field
-
Once it is data enabled you will notice that the value will be changed to "$username"
-
You can playback this script from the Test Designer IDE itself to check the script is data-enabled and picks a row from the sheet to playback successfully
Adding Descriptions for Each Step
You can add descriptions for any and all steps in your test script. This lets you document the important details such as a specific search operation or a check about login, etc. You can tab between Description fields when updating descriptions for the steps in the IDE. This lets you enter and edit descriptions quicker and easier.
In all AIQ reports, the added description will be replaced as the step names.
The ability to tab between Description fields was added in the AIQ 4.8.2 release. Previously, you needed to click each Description field before entering or editing the description.
-
Open an existing test script or record a new test script.
-
In the Description column, you can double click a step and write a description for that step. Tab between Description fields when updating descriptions for multiple steps.

-
Be sure to save the file after adding descriptions.
Debugging : Using Breakpoints and Step Over
Debugging is an important part of scripting, and some tools are required to debug a failure or maybe add some steps to an existing script as we know today's applications are prone to many changes.
Below are some options that are available for debugging.
Breakpoints
-
Record a new script or open a script that is already recorded using File > Open
-
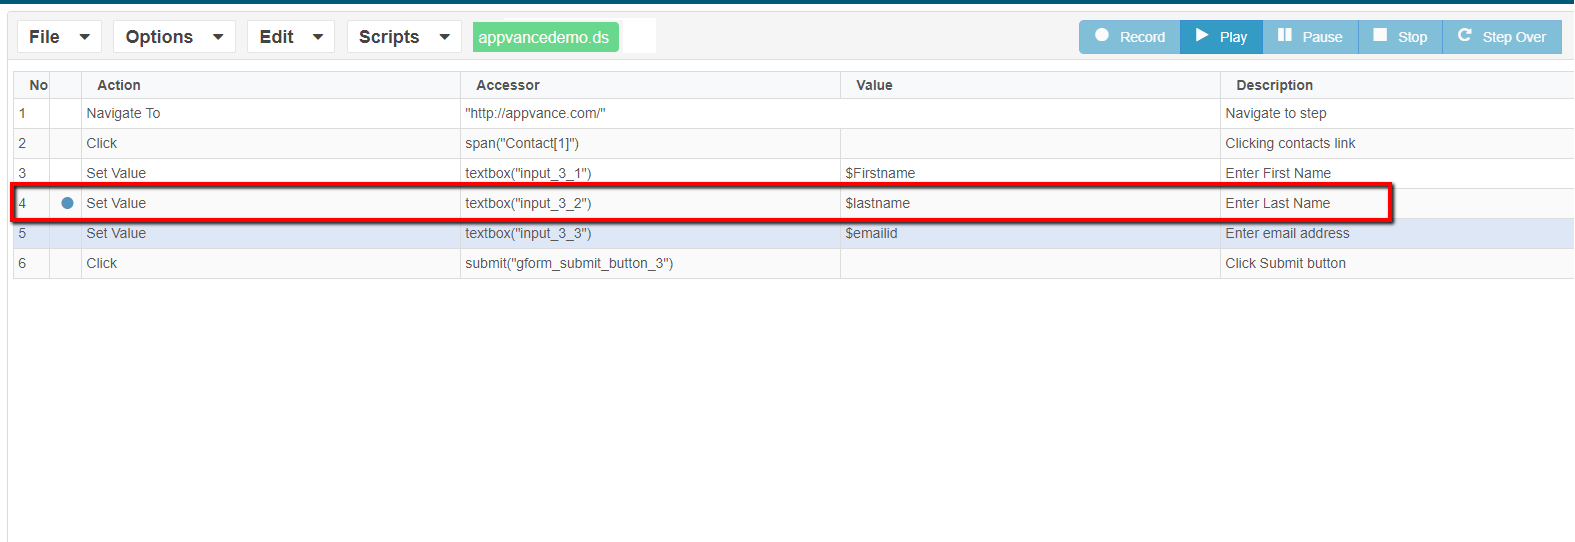
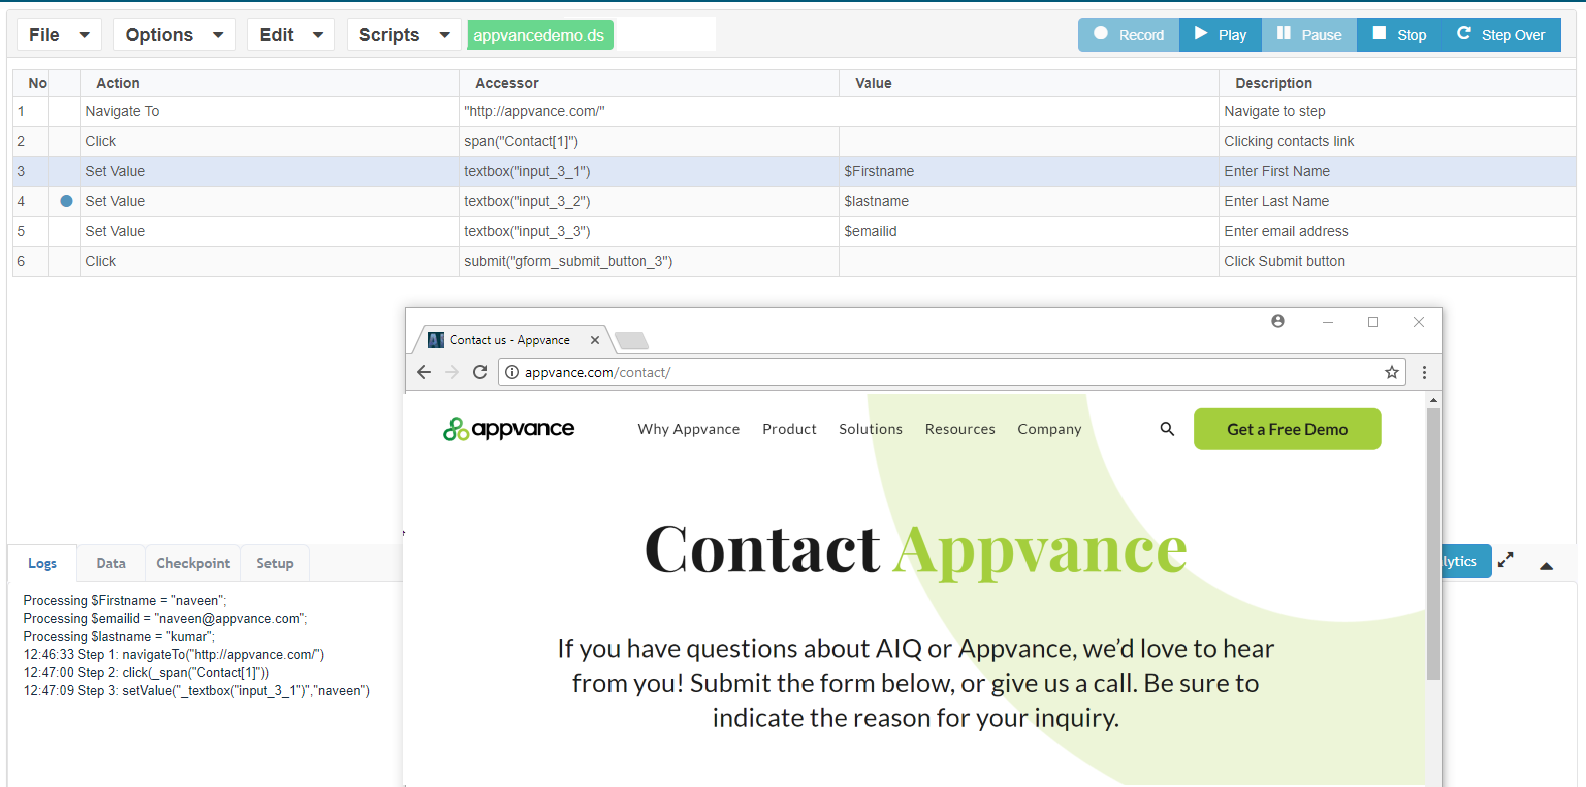
To set a break-point, double-click a command number (on the left side) in the script. A small blue dot appears. To remove the break-point, double-click the line again
-
When you run a test script, Appvance Designer will stop whenever it encounters a break-point. Alternately, you can also pause a running test using the Pause Button
-
Whether you pause a test or hit a break-point, Test Designer highlights the steps that indicate the current step in the script
-
Use the Step Over button to execute the next command in the script. As you step through the script, the script actions are performed in the browser and the marker is updated to show the current step
-
To continue running the script normally, click Play. You can also shut down the script and the browser with Stop
Rick Click Menu Options
-
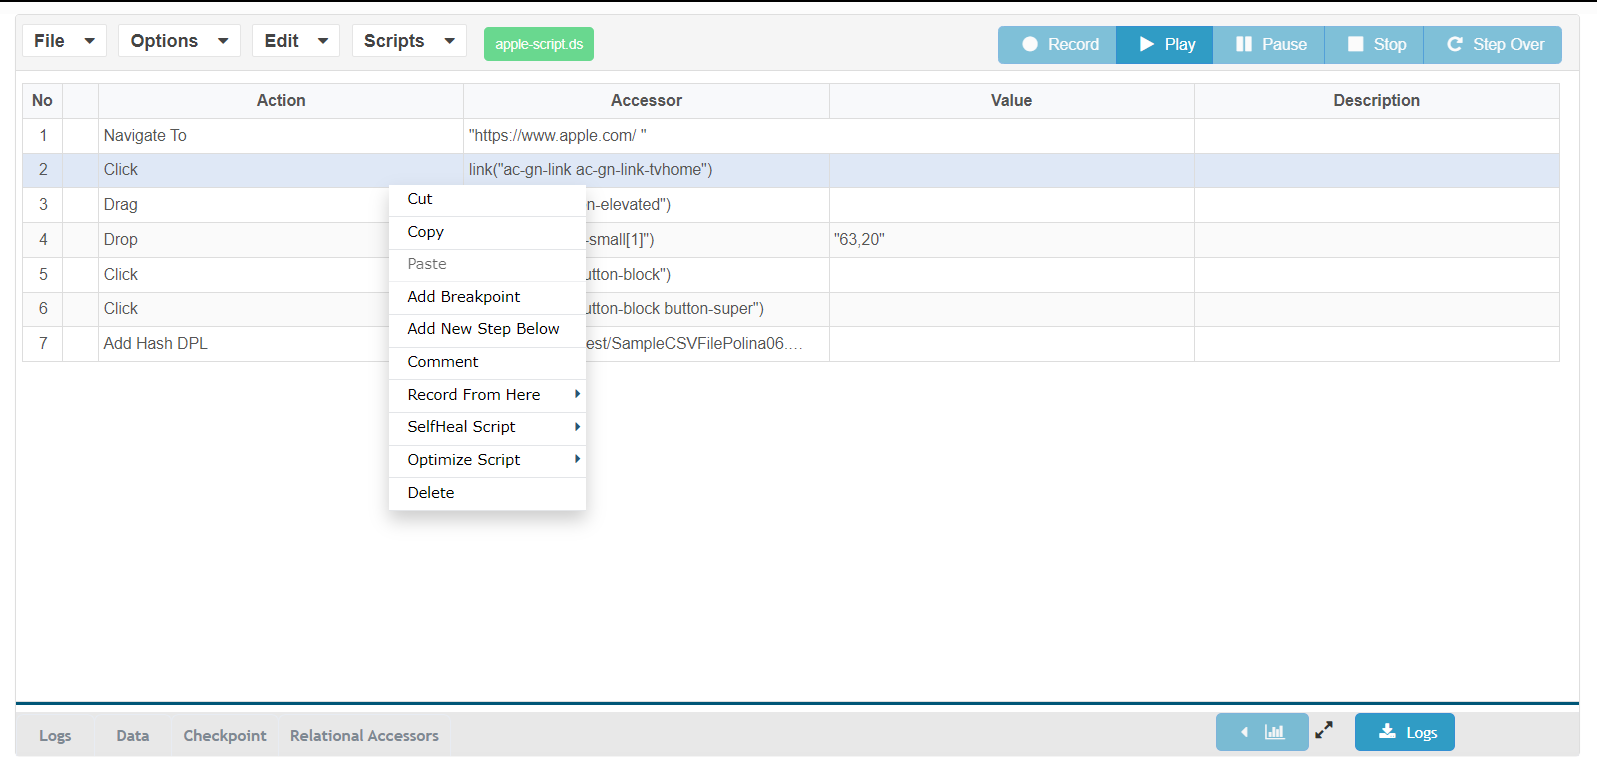
Cut - Select single or multiple steps (using shift keys) and use the cut option to cut the steps which can be pasted back where ever desired by using the Paste option in the same context menu.
-
Copy - Select single or multiple steps (using shift keys) and use the copy option to copy the steps which can be pasted in the IDE where ever desired using the paste option in the same context menu.
-
Paste - Paste can be used to paste the steps that were either cut or copied from the context menu.
-
Add Breakpoint - This is another way to add the breakpoint, you can either double click or use the context menu to add or remove breakpoints.
-
Add New Step Below - This is again another important option that is available, you can right-click and add a new empty step below where you can add your step as desired, Action can be selected from the drop-down and Accessor can be typed in along with the value.
New steps can be added from some conditional statements like if, else if, and for looping statements like while loops, etc. -
Comment - Comment and uncomment is an important debugging option, a set of steps could be commented out by right-clicking the step > Comment.
The commented step would not be played back while replaying the script.
Similarly, you can uncomment the same step by right-clicking on the step and then choosing to uncomment.
Make sure to save the scripts after making any changes. -
Record From Here - This is a required debugging option when you want to add more steps to your existing designer scripts, Right-click and choose this Option after opening your script and the script shall playback till this point (with the selected browser) and you will be able to continue to record which adds those steps into your scripts.
-
SelfHeal Script - Self-Healing is one of the great features of a Test Designer, Self-healing has the power to remove invalid locators/identifiers, has the power to add any valid locators/identifiers, all it needs is one valid locator to add or remove the other locators.
It is always recommended to use this feature with Fallback locators turned ON from the Options drop-down.
Open any existing script in Test designer, right-click the grid, mouse hover on SelfHeal Script, and choose any desired browser for the script to playback.This also applies to SmartTags, when the designer script is used or created based on the SmartTags (which internally have importance for the rules), the importance of those rules gets changed when you self-heal a script.
See Self-Healing Process for more details.
-
Optimize Script - Just like self-healing, Optimize script is a powerful feature of Appvance IQ's Test designer where it helps you to pick the right accessor with the given list of accessors for any step by re-running the script for 5 times and adding weights to each of the available accessors depending on how they were found on each run and at the end of 5th iteration, it will give the accessor with the highest weight that is already picked by the feature and script ready to playback.
SeeOptimize Process for more details.
-
Delete - Selecting some steps and choosing delete will delete the steps from your script.
Adding Complex Code or JavaScript to my script involving more loops and conditions
If yo want to Adding Complex Code or JavaScript to my script involving more loops and conditions
You can use JS Editor where you can add java-scripts or any other complex piece of code, please refer DS3.0 JS Edit & Play chapter for more details. JS Edit & Play for Web Testing
Using Regular Expressions
Query:
We need a generic statement for the below accessor.
cell("Attachment for Issue # 40")As in the 40 will be replaced by any random number.
Solutions:
Here are some of the reg ex that you can give a try and these are the accessors.
cell(/Attachment for Issue #/)
cell(/Attachment for Issue/)
cell(/Attachment/)
cell(/Attachment for Issue #/[0-9]/)

Regarding window titles: The pop-up window titles are sometimes unique and how to deal with those?
Any particular unique text can be used to identify the window say if the Window's actual title is "Southwest Airlines: hotels" for the Select Window step we can use "hotels" on the value column so that the Test Designer can identify that particular window.
Connection Timeout System
During playback, when you notice sometimes see the "File does not exist" message on the playback browser, it is due to the connection time out, below are the details:
It will wait up to 60 seconds if:
-
Host exists
-
Socket is available
-
If the host does not exist, it will fail almost immediately.
-
If the port is not open, it will fail in about 20 seconds.
-
If the connection is reset, it will fail almost immediately.
-
If the port and socket are there but take longer than 60 seconds, it will close the connection at 60 seconds.
-
The 60 seconds can be configured in the global.config file (Location: \..\utp_distribution\NetworkProxy\config\global.config)
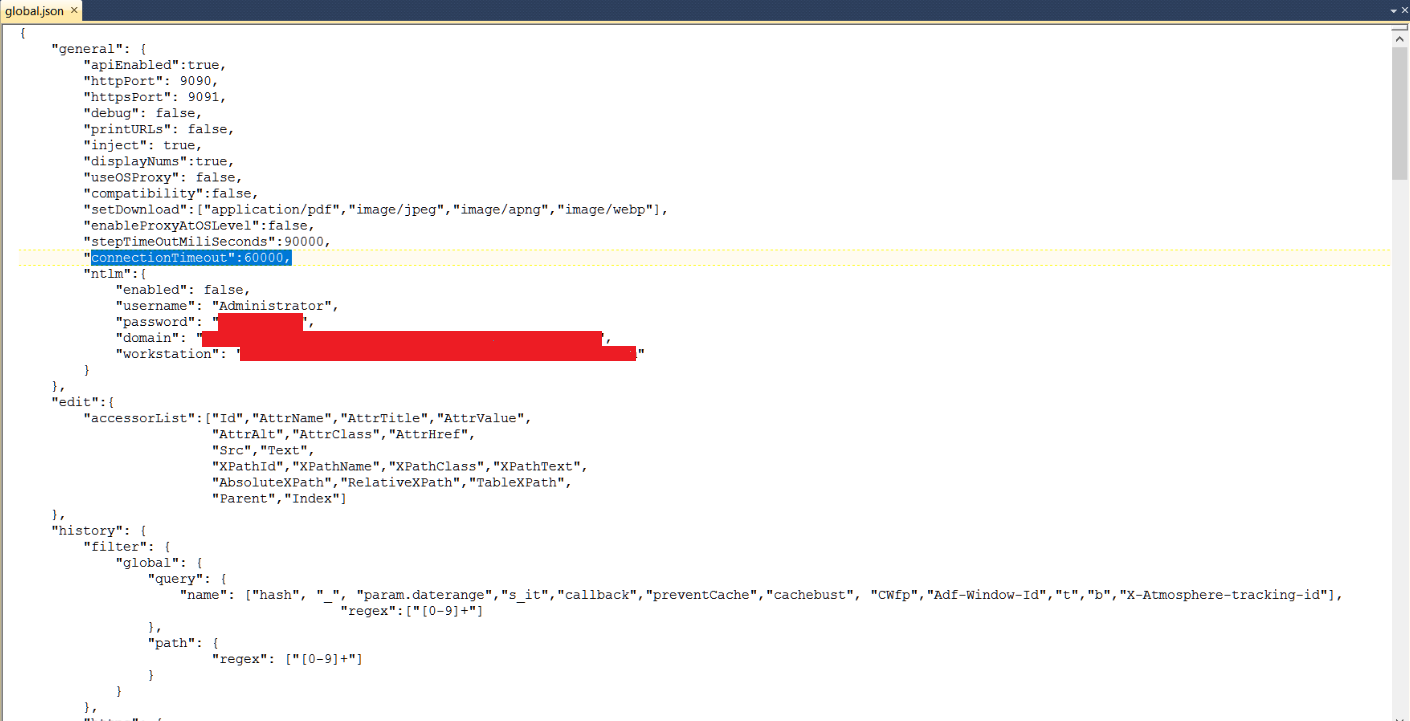
Certain elements have been redacted in the above screenshot.