
Instant Replay
Test Designer Instant Replay
Overview
HowTest aboutDesigner RecordingInstant NetworkReplay allows you to capture network activity in the background while you are recording youror playing back UX test cases usingin Test Designer?Designer.
TestWhile Designera test case is being recorded or executed, Instant Replay iscaptures the answer.network Yes,traffic Testgenerated Designerby the browser. The captured traffic can then be reviewed, saved, compared against another recording, or exported in multiple formats for further analysis and testing.
Instant Replay can captureexport allrecorded yourtraffic as:
- HAR — Includes the recorded network
activitycallswhileand the associated page content. - CSV — Contains details such as HTTP method, port, virtual host, URI, and response status. The CSV can also be used as a
uselogcasein Appvance AIQ. - JS — Generates an executable JavaScript file containing the recorded HTTP requests, such as GET and POST calls.
This functionality is gettingparticularly recordeduseful inwhen a UX test needs to be analyzed at both the browser level and the protocol/API level. The same traffic captured during a Test Designer and itexecution can be exportedused as a .zipstarting (withpoint HARfor creating or extending performance tests.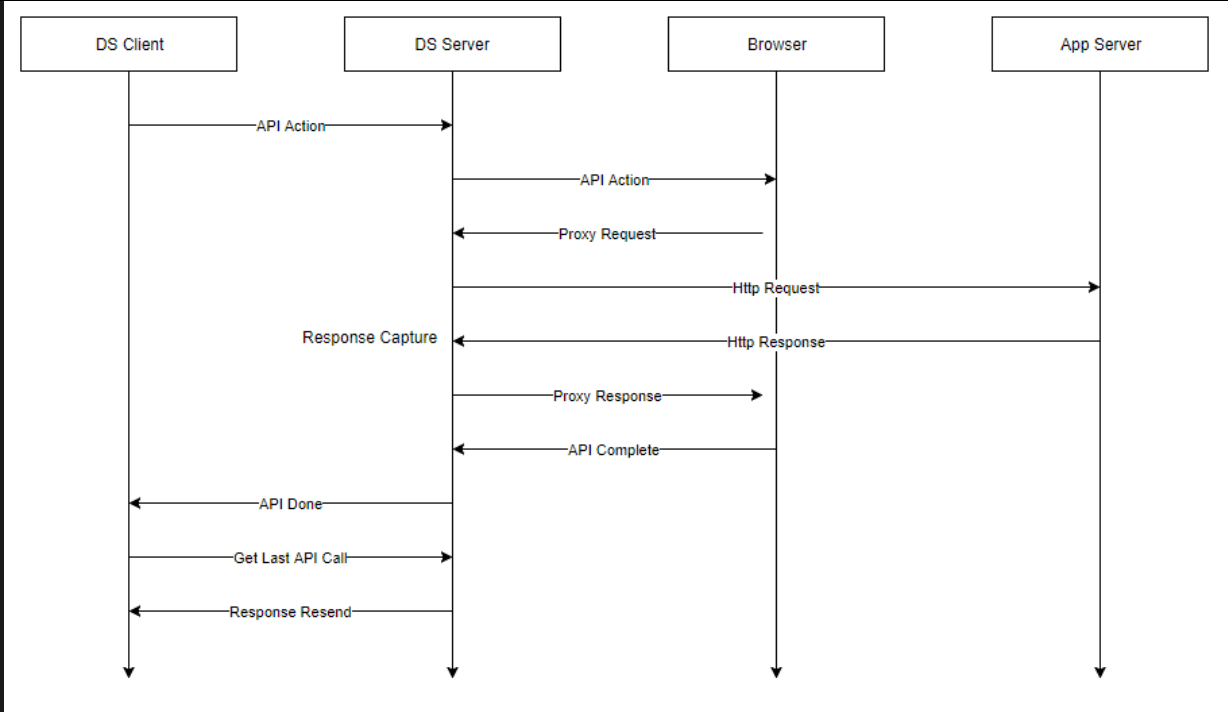
API and contentsNetwork ofTraffic the page), CSV file that has details of the method, port, vhost, uri, status and also as an executable JS fie.
API Testing Process:
When an API request is done,generated during a Test Designer tellsrecording or playback, Test Designer instructs the browser to doperform the request,request. butInstant itReplay injectscaptures athe resulting network activity by injecting the required header information into the browser requests.
This allows Instant Replay to capture andthe provideHTTP traffic generated by the application without requiring the user to manually identify each API calls.request.
WithThe captured information can then be reviewed directly in the option,Instant Replay interface or exported for additional processing.
Excluding Requests
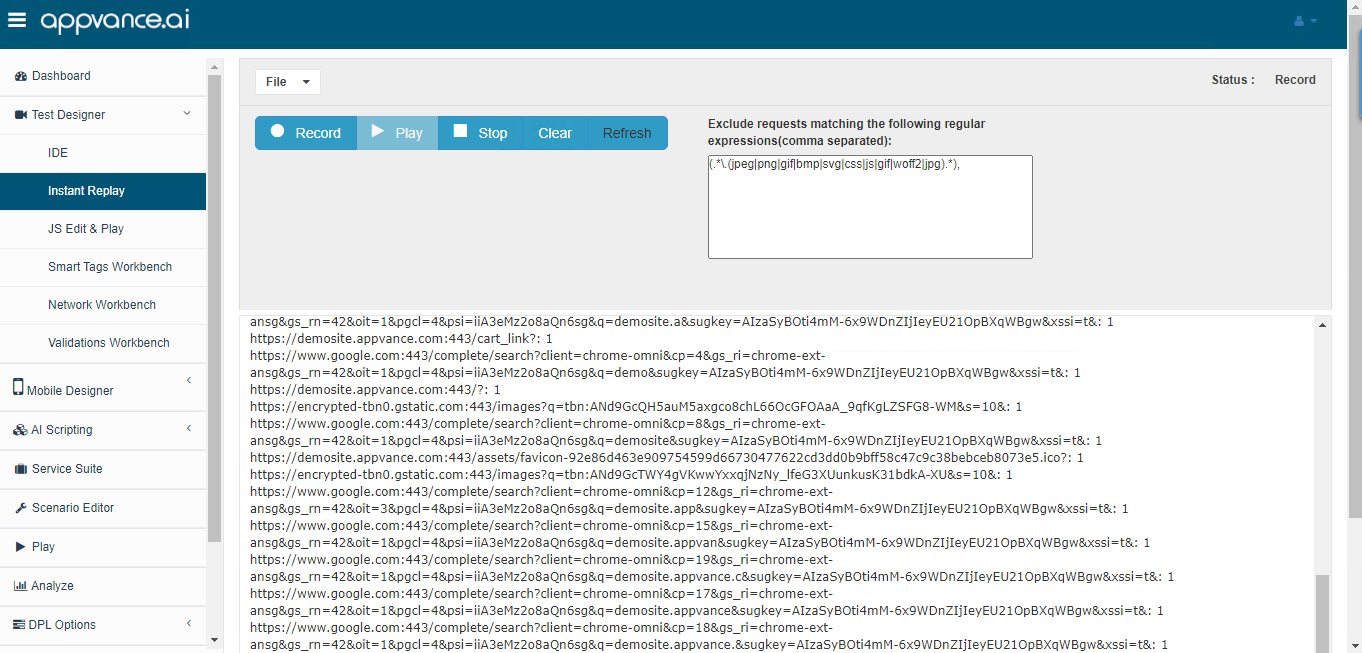
Instant Replay provides the following option:
Exclude requests matching the following regular expressions(expressions (comma separated):
The default valuesexpression ofexcludes (common static resources:
.*\.(jpeg|png|gif|bmp|svg|css|js|gif|woff2|jpg).*),These filters are useful when the objective is to focus on API or application traffic rather than static resources.
The expression can be modified according to the requirements of the test. You can:
- Add additional file extensions.
- Remove extensions from the default expression.
- Modify the regular expression to exclude specific resources.
- Configure the filter
outaccordingall those files withto thementionedtypeextensions,ofyoutrafficcanthat needs to be analyzed.
Note: Review the exclusion expression carefully before recording. Overly broad filters may remove
ornetworkaddrequestsorthatmakeareany changesrelevant tothesetheextensionstest.
Navigation
To open Instant Replay:
- Open the
requirements.Appvance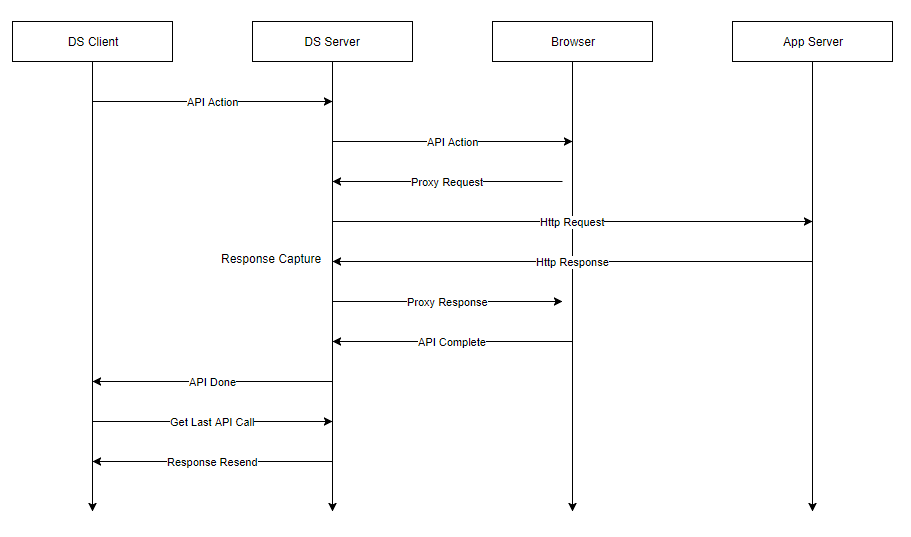
- Navigate to
FromRecord. - Select
the dashboard page, Under Record, ClickTest Designer InstantReplay.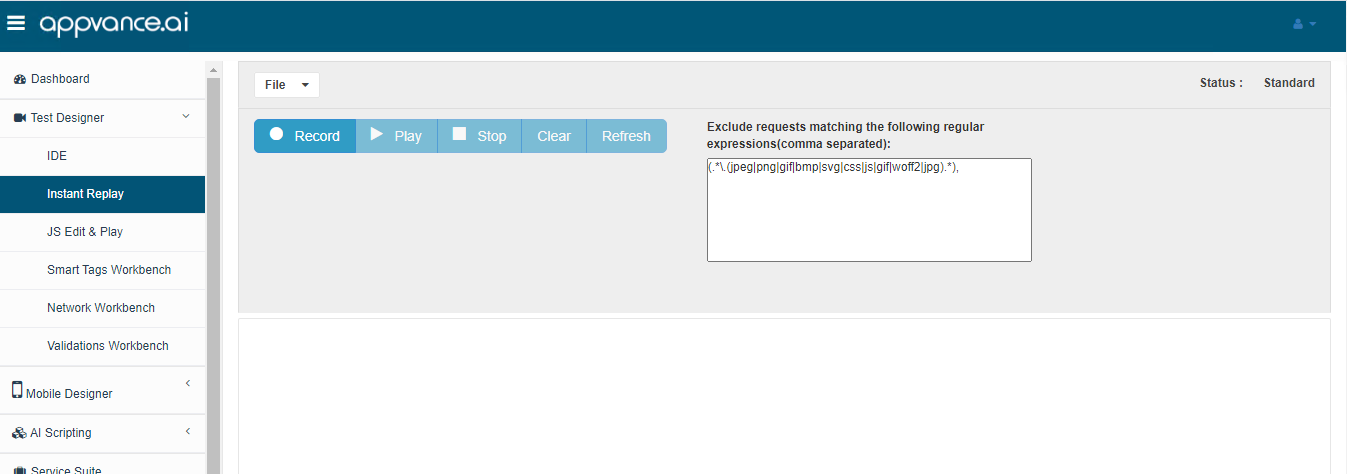
FileThe Menu:Instant
Open:access Only allows .zip files. When you saveto the recorded network traffic, file afteroperations, havingplayback somecontrols, trafficand recorded,export functionality.
File Menu
1. Open
File > SavingOpen will save the file with a .zip extension or whenallows you do a File > Export to HAR,open itan willexisting saveInstant withReplay arecording.
Instant Replay recordings are stored as .zip extension.files.
A residingpreviously insaved recording can therefore be opened from the local machine canby beselecting openedits using.zip file.
Typical use cases
- Reviewing previously captured traffic.
- Reusing a recording as a baseline.
- Comparing a previous recording with a new recording.
- Continuing work with an existing Instant Replay file.
2. Save
File > Open.Save saves the current Instant Replay recording.
Use this option when:
- You have created a new recording.
- You have modified an existing recording.
- You
Save: Is usedwant to save thefilecurrentafterstatechangesoforthe recording.
The recording is saved as a new unsaved.zip file.
Save As: Is used when you want to do a
3. Save As
File an> alreadySave As allows you to save the currently opened fileInstant withReplay recording using a different file name.
This
is useful when you want to preserve the original recording while creating another version.For example, you could maintain separate recordings for:
- QA
- UAT
- Production
- Different users
- Different application versions
- Different test scenarios
4. Comparison Report:Report
The Comparison Report feature allows two Instant replayReplay ziprecordings files canto be compared to check the differences between the Response body, Headers, Payloads.compared.
TypicallyThis usedis forparticularly useful when the same typeworkflow ofis flows,executed withunder different conditions and you need to identify changes in the generated network traffic.
For example, you can compare:
- The same workflow using different login
details,credentials. - The
orsamewithworkflow in differentenvironmentsenvironments. - Different
toapplicationcheckversions. - Different
theconfigurations. - Baseline and current test executions.
The comparison can identify differences betweenin:
- Response
bodies,bodies - Request
headers,andorresponsepayloads.headers - Payloads
Generating
Exporta :
Comparison Reports
Report
To generate thea comparison report,report:
- Open
firstInstantneedReplay. - Select
to load the open the instant replay file to compare against baseline data by making use ofFile > Openand open. - Open the Instant Replay
.zipfile thatiswillsavedbe used as theinstantcurrentreplay ofrecording. - Open the
script.File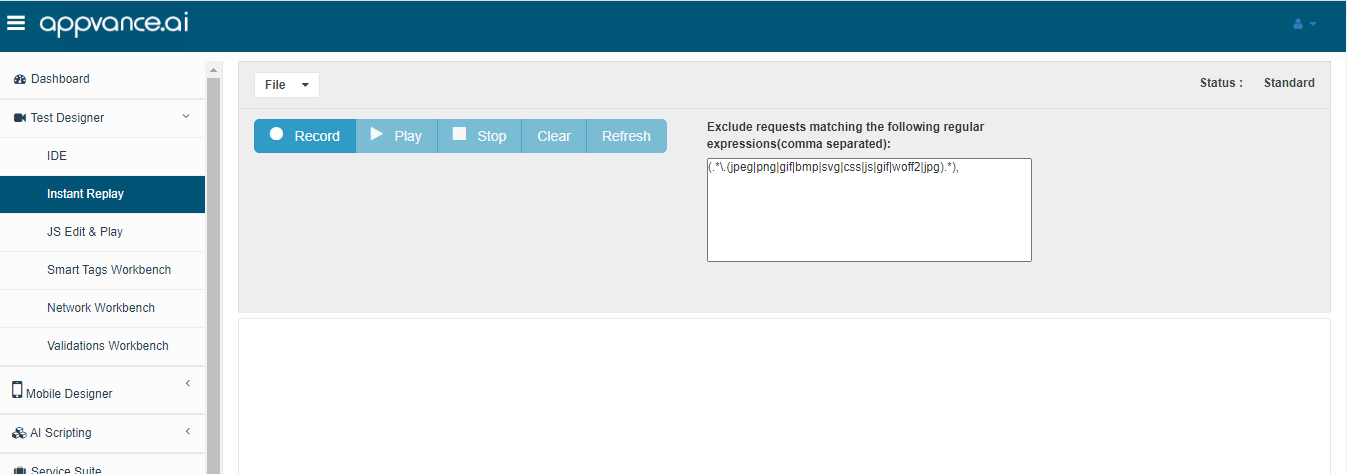
- Select
Click File and chooseComparison Reportfrom the Drop-down.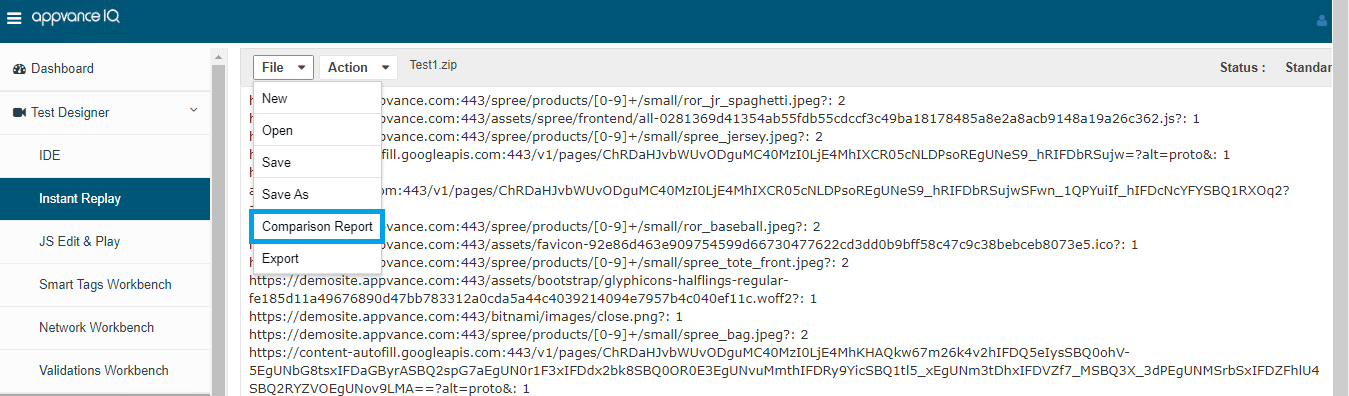
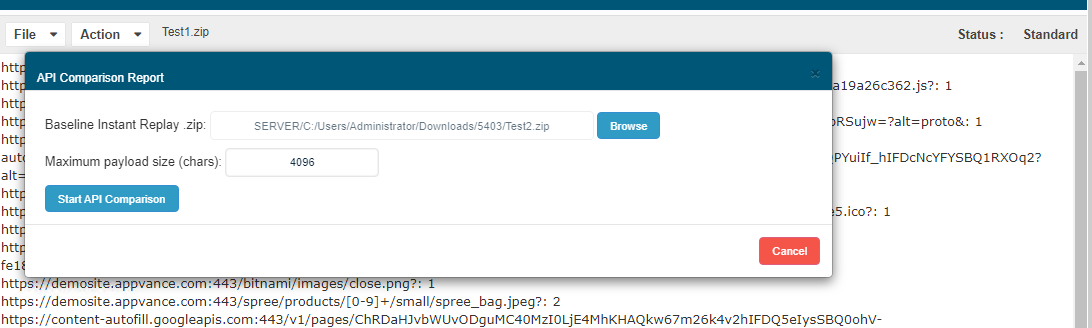
An API Comparison pop-updialog wouldwill beappear.
- Use Browse to
chooseselect the baselinedata to fileInstant Replay(.zipfile)file. - Configure
with the Browse button.Maximum payload size (chars)
:wouldif required. - Click Start Comparison.
The default tomaximum 4096payload chars but thatsize is something4096 thatcharacters. The value can be changedmodified as required and allows onlyaccepts numerical entries.values.
StartAfter Comparisonthe buttoncomparison wouldis be enabled, clicking which will downloadcompleted, a .zip file containing all the reports.
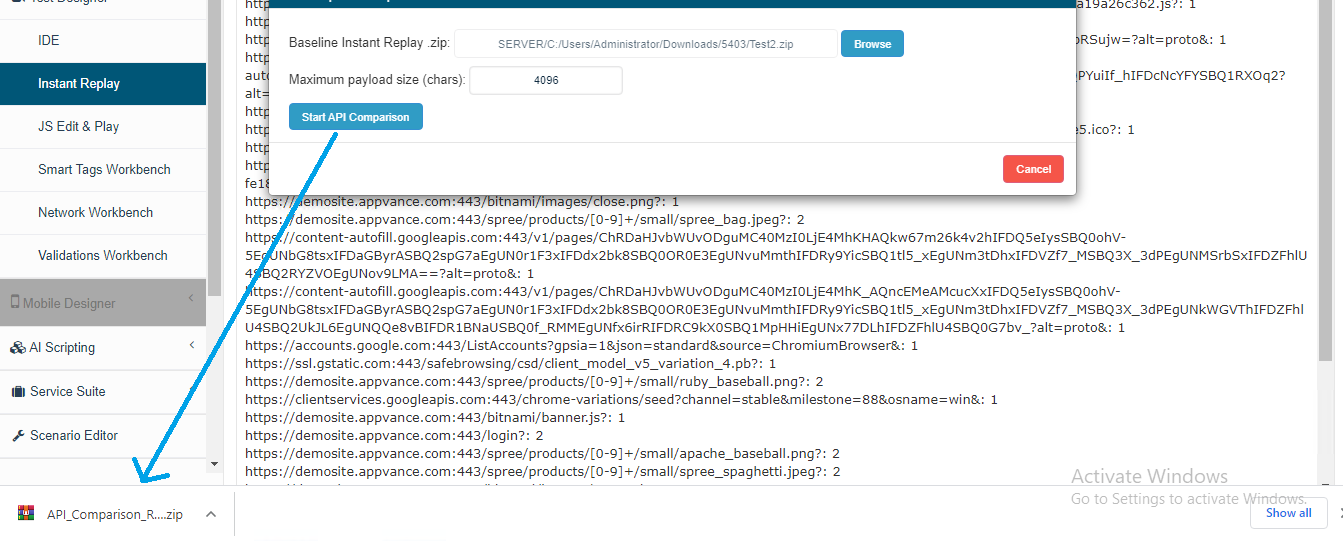
It is required to extract the downloaded zip content of the files and open the generated reports will be downloaded.
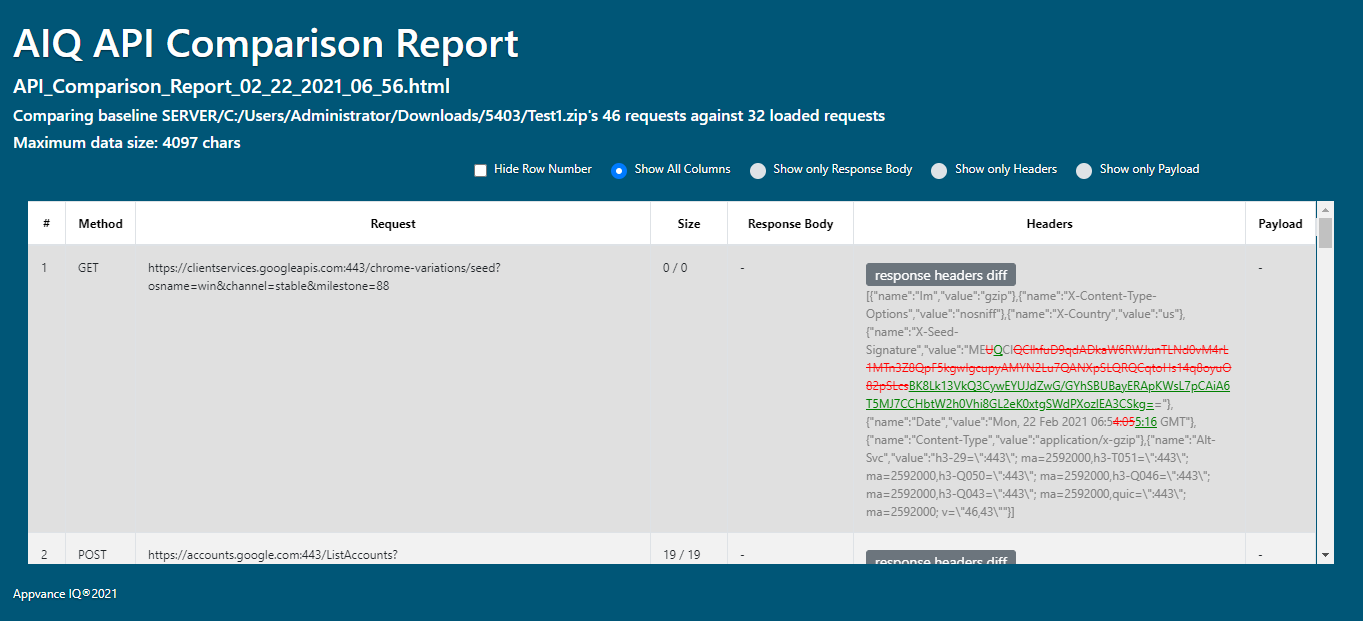
Viewing the Comparison Report
The generated comparison .zip file must be extracted before viewing the report.
After extracting the files:
- Locate the generated
.htmlfile. - Open

BelowHTMLisfile in a web browser. - Review the comparison results.
The report thatprovides isinformation goingabout:
- The comparison report file
name, thename. - The files
that areused forcomparison,theandcomparison. - The
theconfigured maximum data size. - The requests included in the comparison.
- Response body differences.
- Header differences.
- Payload differences.
Understanding the Comparison Results
The report displays the recorded requests and their associated data.
It displays all the Requests along with the size, Response Body and the differences for each of the rows whichRows can be expanded/collapsed,expanded Headersor collapsed to inspect additional information.
The comparison includes the following areas:
Requests
The request section provides information about the recorded requests and request/their corresponding data.
Response Body
The response headerbody section highlights differences whichbetween the baseline and current recording.
Headers
Header differences can be expanded/collapsesexpanded forto eachinspect ofindividual therequest rows,and response header changes.
Payload
Payload with differences for each of the rows which can be expanded/collapsed.expanded to compare request data between the two recordings.
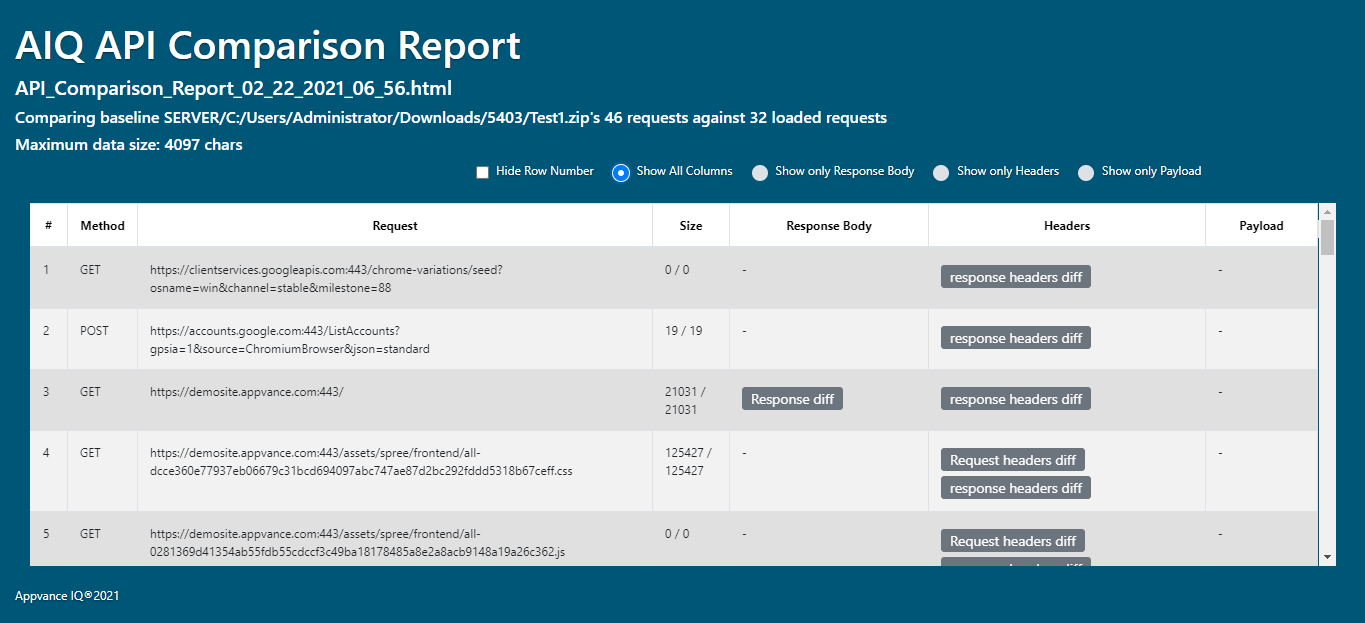
Difference Indicators
ThereThe comparison report uses visual indicators to make differences easier to identify.
-— No data was found.- Green — Data was added or is
anpresentoptionin the current recording but not in the baseline. - Red — Data was removed or is missing from the current recording.
These indicators make it easier to hideidentify orchanges showwithout manually reviewing every request.
Report Display Options
The comparison report also provides options to customize the row numbers.
Also, the option to choose a particular column that needs to beinformation displayed.
You cancan:
- Show
eachorofhidetherowbuttonsnumbers. - Select
likewhich"responsecolumnsheadersarediff"displayed. - Expand or collapse individual comparison sections.
- Select specific differences, such as Response Headers Diff, for
exampledetailedtoinspection.
5. differences.
"-" means no data found
The green color means some data has been added
The red color means some data has been removed or not found
6. Export: The recorded traffic can be exported tointo 3three formats:
- HAR
- CSV
- JS
Each format serves a different formats.purpose.
5.1 HAR Export
The HAR export contains the recorded HTTP traffic in a format suitable for analyzing browser network activity.
a)The HAR:export downloadedis provided as a .zip file,file containscontaining:
Record.har- Recorded history and associated resources.
Depending on the harapplication calls "Record.har" plus alltraffic, the historyarchive containingmay .jpg's, .html's, txt's, .dat's, .jsoncontain files etcsuch as:
.jpg.html.txt.dat.json- Other resources captured during the recording.
b)HAR CSV:is Containsuseful detailswhen you need to preserve the network activity together with the resources associated with the recorded page.
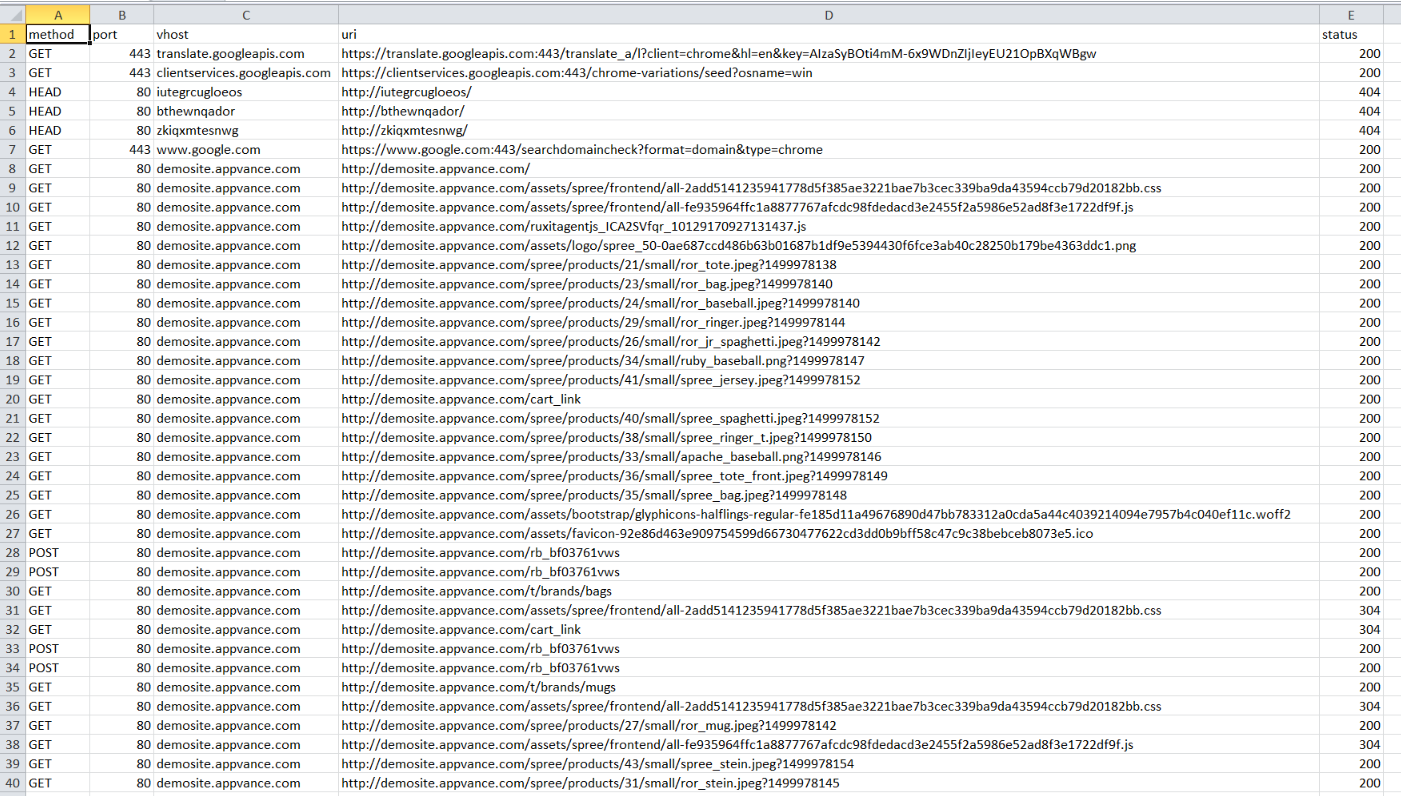
5.2 CSV Export
The CSV export provides a tabular representation of the method,captured port,traffic.
The uri,CSV status.includes Thisinformation such as:
- HTTP method
- Port
- Virtual host
- URI
- HTTP status
The CSV can be useduseful for:
- Reviewing captured traffic.
- Filtering requests.
- Analyzing network activity.
- Creating logs.
- Using the captured information as a log
fromin AppvanceAIAIQ. - Performing additional processing with spreadsheet or data-analysis tools.
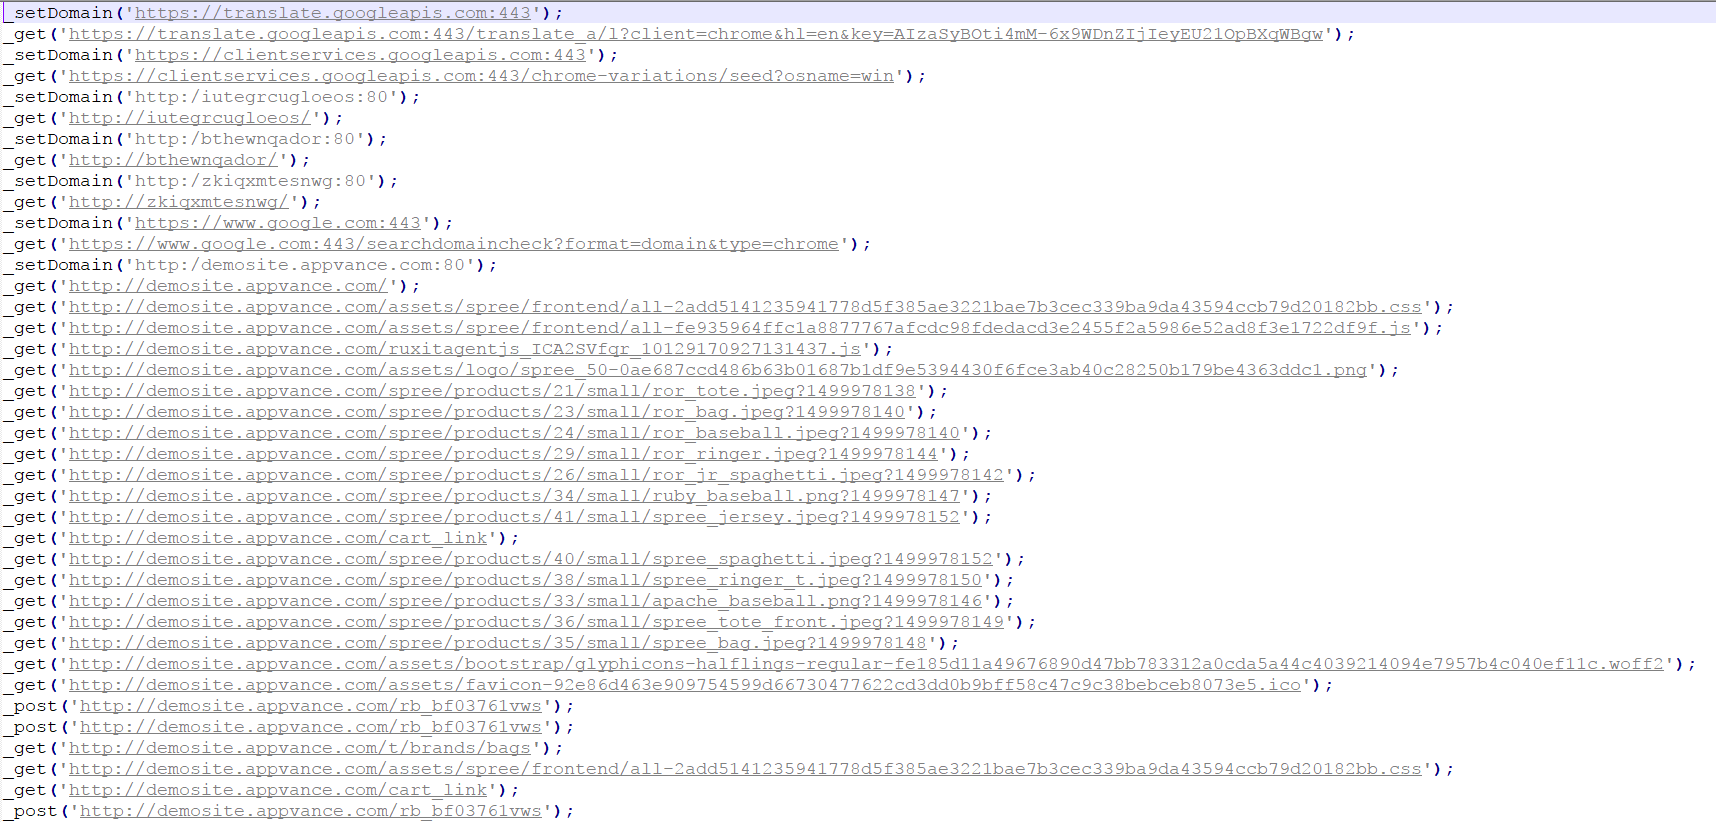
5.3 JS Export
The JS export generates an executable JavaScript file containing the recorded HTTP requests.
The generated script can include requests such as:
- GET
- POST
- Other HTTP requests captured during the recording.
This export can be useful when the captured API traffic needs to be reused as wellpart of an automated or protocol-level test.
Actions Menu
1. Start Recording
Actions > Start Recording starts capturing network traffic.
After recording starts, Instant Replay captures the oneHTTP below
traffic generated by the application while you record or execute a test in Test Designer.
2. Re/Start Playback
Actions Menu:
Re/Start Recording:Playback willclears startthe historical traffic and starts a fresh recording HAR traffic for the appplayback operation.
This is useful when you want to ensure that willthe betraffic displayed belongs only to the current playback.
Use this option when you want to:
- Remove previously recorded
usingtraffic. - Start with a clean history.
- Execute a Test Designer script.
- Capture the traffic generated by that execution.
3. Stop
Actions > Stop stops the current network traffic recording.
After recording is stopped, no additional traffic is captured until a new recording is started.
4. Clear History
Actions > Clear History removes the traffic currently displayed in the Instant Replay recording area.
This allows you to start a new recording without previously captured traffic remaining in the current view.
5. Show Calls
Actions > Show Calls refreshes the displayed network traffic.
Use this option while a recording is in progress to update the Instant Replay interface with newly captured requests.
It is useful when traffic is being generated in another window, such as the Test Designer IDE.
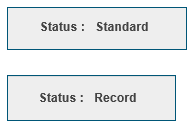
Status
Re/StartThe Playback:current willrecording clearstate is displayed in the historicalupper-right data which is already present and make a fresh recordingarea of the requirementInstant forReplay playback.interface.
The
status changes according to the current operation.Standard
Stop:The willinitial stopstate of Instant Replay.
No active network recording HARis trafficin calls.progress.
Record
ClearDisplayed History:after willStart simplyRecording clearis yourselected.
Instant areaReplay andis itactively willcapturing be ready to record new HARnetwork traffic.
Standard
afterShow calls: This is more like a refresh button, that keeps updating the new traffic that got recorded.
Status:
You will see Status on the top right corner of the page, Initially Status will be Standard.
When youStop clickis Start Recording fromselected, the Actionstatus menu bar Status will changereturns to Record,Standard, andindicating Again, Status will be Standard when you click Stop fromthat the Actionrecording menuhas bar.ended.
How to use
Using Test Designer Instant Replay
Recording a New Test Case
Follow these steps:steps to capture network traffic while recording a new UX test case.
Step
1Go— toStart Instant Replay
Open Test Designer Instant Replay and clickselect:
Actions > Start Recording
Instant Replay begins capturing network traffic.
Step 2 — Record the drop-down.UX
Go backReturn to the Test Designer IDE.
Select:
Record > chooseBrowser
Choose the required browser and perform yourthe actions that make up the UX actions.test case.
As
the browser interacts with the application, Instant Replay captures the generated network traffic.Step 3 — Display the Captured Traffic
Come backReturn to Instant ReplayReplay.
Select:
Actions > Show Calls
The captured network calls will be displayed.
You can repeat Show Calls while recording to refresh the displayed traffic and clickview Shownewly callscaptured fromrequests.
Step 4 — Complete the ActionRecording
When the trafficUX thatrecording is getting captured.complete:
- Return to Instant Replay.
- Select Actions > Stop.
Once done with allReview therecording,capturedyou can go ahead and savetraffic.- Save the
filerecording as a.zipfile oranyexportotherit2toformatsHAR,mentionedCSV,above.or JS as required.
Capturing Traffic During Test Playback
Instant Replay is not limited to recording new test cases.
It
can also capture network traffic generated when an existing Test Designer script is played back.NotTo justcapture recording,playback traffic:
- Open an existing Test Designer script.
- Open Test Designer Instant Replay.
- Select Actions > Start Recording.
- Return to the Test Designer IDE.
- Execute or play back the existing script.
- Return to Instant Replay.
- Select Actions > Show Calls.
- Review the network traffic generated during playback.
- Select Stop when playback is complete.
- Save or export the captured traffic as required.
This allows you to analyze the actual network activity generated by an existing UX test without manually identifying each API call.
Recording and Playback Workflow
The typical workflow is:
Test Designer Instant Replay
        also|
        records| theStart historyRecording
        calls when we playback scripts from Test Designer.
Go back tov
Test Designer IDE,IDE
open|
any| existingRecord script,or comePlayback
v
Browser
|
| HTTP / HTTPS traffic
v
Instant Replay
|
+------------------+
| |
v v
Review Export
|
+-------------+-------------+
| | |
v v v
HAR CSV JS
This workflow makes it possible to Instantassociate Replay,a clickbrowser-level 'StartUX Recording'test and playbackwith the scriptnetwork/API fromactivity generated by that test.
Using Captured Traffic for Performance Testing
One of the primary benefits of Instant Replay is the ability to use captured network traffic as a starting point for protocol-level performance testing.
A Test Designer IDE,script andoperates you can click 'Show calls' fromat the Actionbrowser/UX menu,level, you will notice allwhile the trafficexported that it got created.
TheseAPI traffic logs can be used to generate moretraffic at the protocol level.
This makes it possible to analyze or reproduce the same application workflow at different levels.
For example:
UX Test
   |
   | Test Designer
   v
Browser-level execution
   |
   | Instant Replay
   v
Captured network traffic
   when|
   running+----> asHAR
   |
   +----> CSV
   |
   +----> JS
             |
             v
      Protocol/API testing
             |
             v
      Performance testing
The captured traffic can therefore complement the original Test Designer script.
For example, a performance test (runningmay atuse:
- The
protocol level) using along with the actualoriginal Test Designer script(runningtoatvalidate thebrowserbrowser-levellevel).user experience. - Captured API traffic to generate higher volumes of protocol-level traffic.
This approach can help separate UX validation from backend/API scalability testing while maintaining a relationship between the two test levels.
Recommended Use Cases
Test Designer Instant Replay can be useful in several scenarios.
API Discovery
Capture the network calls generated by an application while recording a UX workflow.
This can help identify:
- API endpoints.
- HTTP
Troubleshooting
Capture network activity generated by a failing UX test and inspect the requests and responses associated with the failure.
Environment Comparison
Record the same workflow in different environments and use Comparison Report to identify differences in:
- Responses.
- Headers.
- Payloads.
- API behavior.
Version Comparison
Capture the same workflow before and after an application change and compare the resulting network traffic.
Performance Test Preparation
Use captured API traffic as a starting point for protocol-level performance testing.
Regression Analysis
Compare a baseline recording with a new execution to identify unexpected changes in application traffic.
Example: Comparing Two Environments
Suppose a login and checkout workflow is executed in QA and UAT.
The workflow is:
Login
  |
  v
Search Product
  |
  v
Add Product to Cart
  |
  v
Checkout
  |
  v
Logout
The workflow can be recorded in QA and then repeated in UAT.
The resulting Instant Replay files can be compared to identify differences in:
- API responses.
- Request payloads.
- Response payloads.
- Headers.
- HTTP status codes.
This can help determine whether an environment behaves differently even when the UX workflow appears to be identical.
Example: Comparing Different User Accounts
Instant Replay can also be used to compare the network behavior of the same workflow with different credentials.
For example:
Baseline
User A
   |
   v
Test Designer workflow
   |
   v
Instant Replay A


Comparison
User B
   |
   v
Same Test Designer workflow
   |
   v
Instant Replay B
The two recordings can then be compared to determine whether the application returns different:
- Response bodies.
- Headers.
- Payloads.
- Requests.
This can be particularly useful when investigating role-based behavior or differences between user accounts.
Best Practices
Start with a Clean Recording
Before capturing a new workflow, use Clear History or Re/Start Playback when appropriate.
This helps prevent unrelated traffic from previous recordings from being included in the results.
Configure Request Exclusions Carefully
Use the request exclusion regular expression to remove unnecessary static resources, but make sure that required API traffic is not accidentally excluded.
Save Baselines
When performing comparisons, preserve the original recording as a baseline.
Use Save As to create separate recordings rather than overwriting the baseline.
Use Consistent Workflows
For meaningful comparisons, use the same Test Designer workflow whenever possible.
Changes in user actions can generate legitimate differences in network traffic and make the comparison more difficult to interpret.
Compare Equivalent Environments
When comparing environments, keep the following conditions as consistent as possible:
- Test workflow.
- User permissions.
- Test data.
- Browser.
- Application version.
- Configuration.
This makes differences in the captured traffic easier to attribute to the environment itself.
Review API Traffic Before Performance Testing
Captured traffic should be reviewed before being used for performance testing.
Verify:
- URLs.
- HTTP methods.
- Headers.
- Payloads.
- Authentication information.
- Dynamic values.
- Correlation requirements.
Sensitive or environment-specific information should be handled according to the organization's security requirements.
Summary
Test Designer Instant Replay provides a way to capture and analyze the network activity generated during Test Designer recording and playback.
The captured traffic can be:
- Recorded and reviewed in real time.
- Saved as an Instant Replay
.zipfile. - Compared against another recording.
- Exported as HAR.
- Exported as CSV.
- Exported as executable JS.
- Used as input or reference for protocol-level testing and performance testing.
The key workflow is:
Record the UX → Capture the network traffic → Review the API calls → Compare or export the traffic → Reuse the captured traffic for additional testing.
This makes Instant Replay a useful bridge between browser-level UX automation and API/protocol-level testing, allowing teams to understand not only what the user does in the application, but also the network activity generated behind those actions.
Last updated: August 28,12, 20232026
If you have anyFor feedback onor questions about this topic, pleasedocumentation, contact usthe atappropriate documentation@appvance.aiAppvance documentation or support team.