
Calibration What-if Chart
The nature of Appvance IQ doesn’t enable exploring everything that might happen during a Calibration test. However,
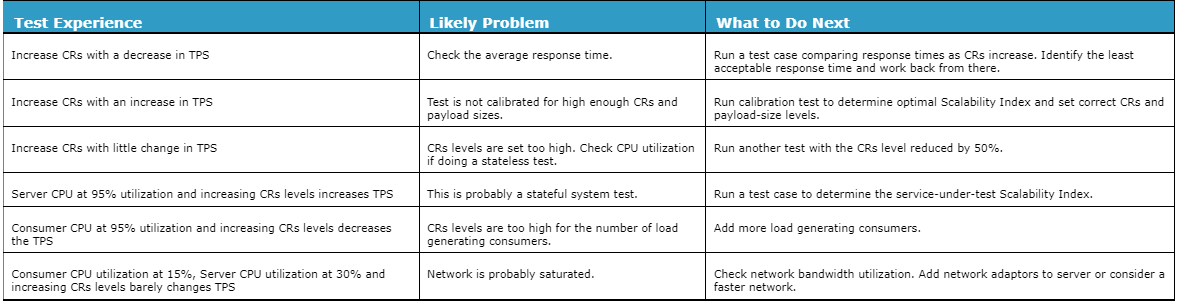
Calibration What-If Chart lists a few significant issues to be aware of.
Calibration Testingtesting showshelps identify how a server'ssystem behaves as the load level changes and provides a basis for selecting appropriate test levels. However, a calibration test cannot account for every possible Transactionssystem Perbehavior Secondor (TPS)bottleneck.
The Calibration What-If Chart provides a set of common test observations, their likely causes, and recommended next steps. Use these observations to determine whether additional calibration is required before proceeding with the full performance test.
Test Experience | Likely Problem | What to Do Next |
|---|---|---|
Increase in CRs with a decrease in TPS | Check the average response time. | Run a test case comparing response times as CRs increase. Identify the maximum acceptable response time and use it to determine the appropriate test level. |
Increase in CRs with an increase in TPS | The test may not be calibrated for sufficiently high CRs or payload sizes. | Run additional calibration tests to determine the appropriate Scalability Index and corresponding CR and payload-size levels. |
Increase in CRs with little change in TPS | CR levels | Run another test with the CR level reduced, for example, by 50%, and compare the results. |
Server CPU reaches approximately 95% utilization and increasing CR levels increases TPS | The test is likely exercising a stateful system behavior. | Run a test case to determine the service-under-test Scalability Index. |
Consumer CPU reaches approximately 95% utilization and increasing CR levels decreases TPS | CR levels may be too high for the number of load-generating consumers. | Add more load-generating consumers and repeat the calibration test. |
Consumer CPU utilization is approximately 15%, server CPU utilization is approximately 30%, and increasing CR levels produces little change in TPS | The network may be saturated or otherwise limiting throughput. | Check network bandwidth utilization. Consider adding network adapters to the server or using a faster network configuration. |
Calibration nexttesting step inprovides the Appvanceinformation methodneeded isto identify practical TPS levels for the system under test based on its current hardware, software, network, and workload configuration.
After calibration, use the resulting test levels to run the realfull performance test and evaluate the system under the intended workload.
Note: The observations in this chart are guidelines rather than definitive diagnoses. Actual bottlenecks may vary depending on the application architecture, workload, payload size, network configuration, and test
at the calibrated test levels.environment.
Last updated:
MarchAugust08,14,20232026If you have any feedback on this topic, please contact us at documentation@appvance.ai.