
Scalability Index
AThe Scalability Index isdescribes how a function of service performanceresponds (into TPS) asincreasing concurrent request (CR) levels and payload sizessizes. changeIt is used during calibration to identify the range in which the service operates efficiently and to determine appropriate load levels for the Full Test.
The chart below illustrates three representative regions of a scalability curve:
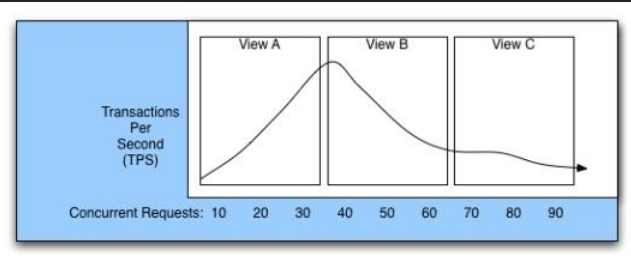
- View A — Underdriving: Increasing the CR level results in a
testcorrespondingscenario as shownincrease inScalabilityTPS.Index.Theservice
still
loadThere are three distinct partsable tothisprocessScalabilityadditionalIndex:
The goal of calibration is to identify the View A:B range rather than simply maximize the CR level. Testing at 10,too 20, and 30 concurrentfew requests (CRs)may levels showsunderutilize the TPSservice, level also rises. Imagine the conclusion if the CRs levels if View A were tested, where the assumption that the service will scale to handle the increase in CRs levels would be made. However, at 40 CRs the TPS value begins to decrease.
View B: Calibration tests seek TPS values for the 40, 50, and 60 CRs levels. In this range, the service responds to a moderate number of CRs at a TPS rate acceptable to the organization hosting the service.
View C: Whenwhile testing at the higherexcessive levels –may 70,introduce 80,saturation andthat 90 CRs –obscures the TPSservice's valueuseful doesscalability notcharacteristics.
Once the conclusionappropriate if the CRs level if View C were tested, where the assumption that the service will not be able to handle an increase in CRs levels would be made. System managers typically buy overly equipped server hardware to contend with situations where the server received too many responses to handle efficiently. The managers could have saved a lot of money if they bought multiple smaller (less expensive) systems and used load balancing to split large loads into multiple smaller loads handled by the multiple servers.
View B shows the optimum where underdriving (too few requests) nor overdriving (too many requests) the service within its CRs levelsCR range occurs.has Ifbeen Viewidentified, Buse is the Calibration Test results, a range of CRsthose levels to use in the Full Test. The same calibrated levels can also be used when comparing alternative APIs, implementations, or products so that their performance results can be evaluated under equivalent workloads.
Identifying Bottlenecks
Resource utilization can help determine what limits scalability during calibration. Depending on the type of our test scenario is defined. At this point, additional run scenarios that use alternative APIsservice and products,test, withreview metrics such as:
- CPU utilization
- Memory utilization
- Network bandwidth
- Load-generator or consumer utilization
- Service response time and TPS
The relevance of each metric depends on the CRsarchitecture levelsand usedbehavior in View B to compareof the TPSservice. results.
In thisFor example, the CPU, network,CPU and memory utilization valuescan areprovide useduseful toinformation determinefor wherestateless performanceservices, andwhile scalabilityresource bottlenecksutilization occur.may Asbe aless noterepresentative of reference, CPU and memory bandwidth are helpful in stateless tests. CPU and memory bandwidth is usually meaninglessscalability for stateful tests.services where other factors determine the system's behavior.
The Scalability Index should therefore be considered together with system-resource metrics and response-time behavior, rather than relying on TPS alone.
Last updated: MarchAugust 08,13, 20232026
If you have any feedback on this topic, please contact us at documentation@appvance.ai.