
Understand AIQ Reports
Last reviewed: September 22, 2026
Use AIQ reports to evaluate execution health, response timing, failures, throughput, and supporting evidence after a test run.
ListRecommended of Available Reportsguidance
Below
- Review
youreportswill findafter thelistrunofisallcomplete for final analysis. - Use live views for monitoring, but final reports for decisions.
- Compare runs only when test data, environment, and load profile are comparable.
Validation workflow
- Open the
UnifiedcompletedTest Platform Reports. The initialexecution reportscreenfromshowsResultselevenAnalysis. - Review
reportssummaryasstatus,shownduration,below.transaction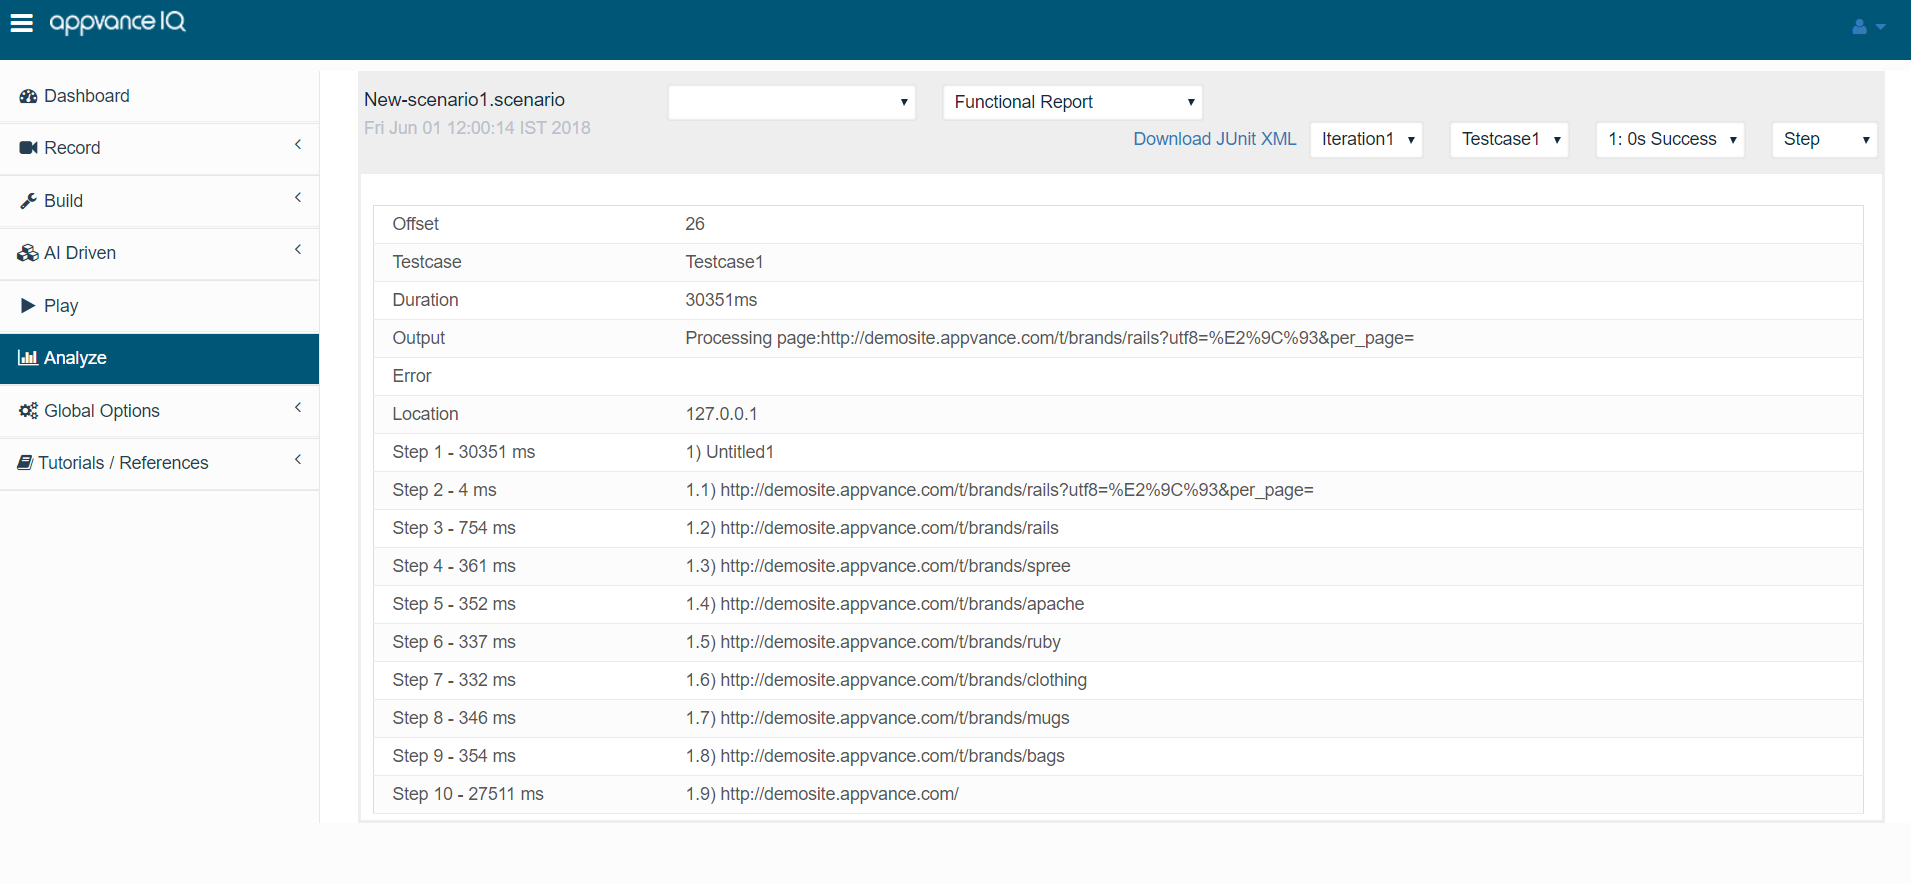
In order to understand bettercounts, andusefailurethese reports it is important to understand some basic concepts:Execution: This is the complete execution of a scenario, it is possible that it can contain several iterations.rates.Iterations:DrillAintoiterationfailedindicates the number of users who run during a certain amount of time, the below screen-shot shows an execution with 2 iterations.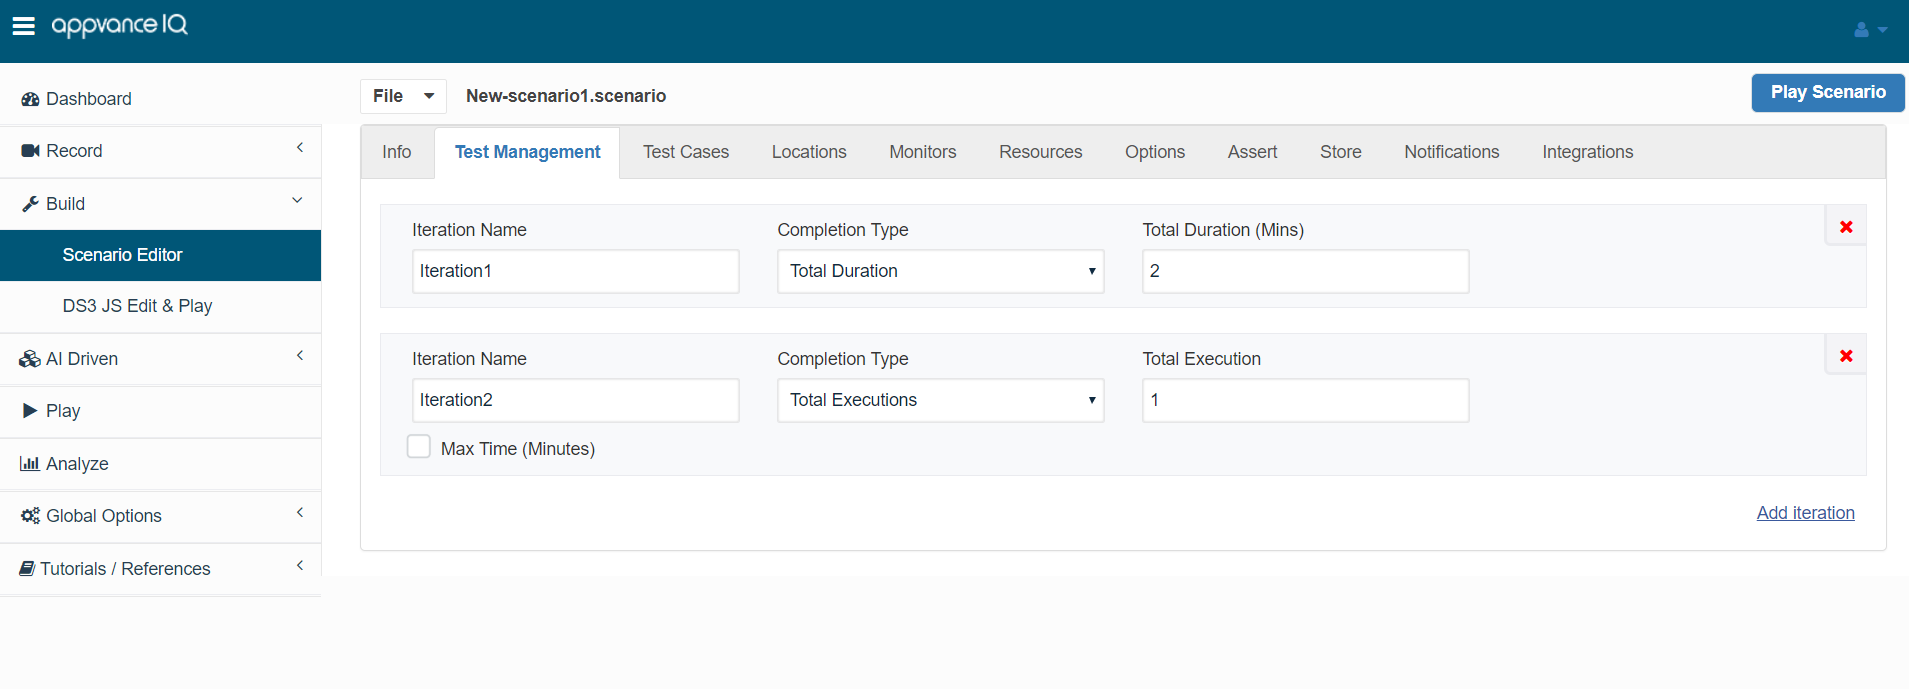
Test Case: Iteration can have onesteps ormore Test Cases. Test Case can be a unit test, a selenium file, or any other supported test type by Unified Test Platform. Test Cases are executed in parallel during an iteration.Template ReportsUsers can create their own Template Reports and create Reports by using these Templates. See the section onReport Templates in the Global Options section of the documentation for information on creating report templates.Server Side Report“Server-Side Only” is a filter where every “row”(step registry) that has a value = 0 in the column “totalRequest” won’t be added in the report. This Report can be used for filtering the Reports.With this not only the “set_value” steps are filtered, but every step where “totalRequest” values are zero gets filtered and becomes a Server Side Report.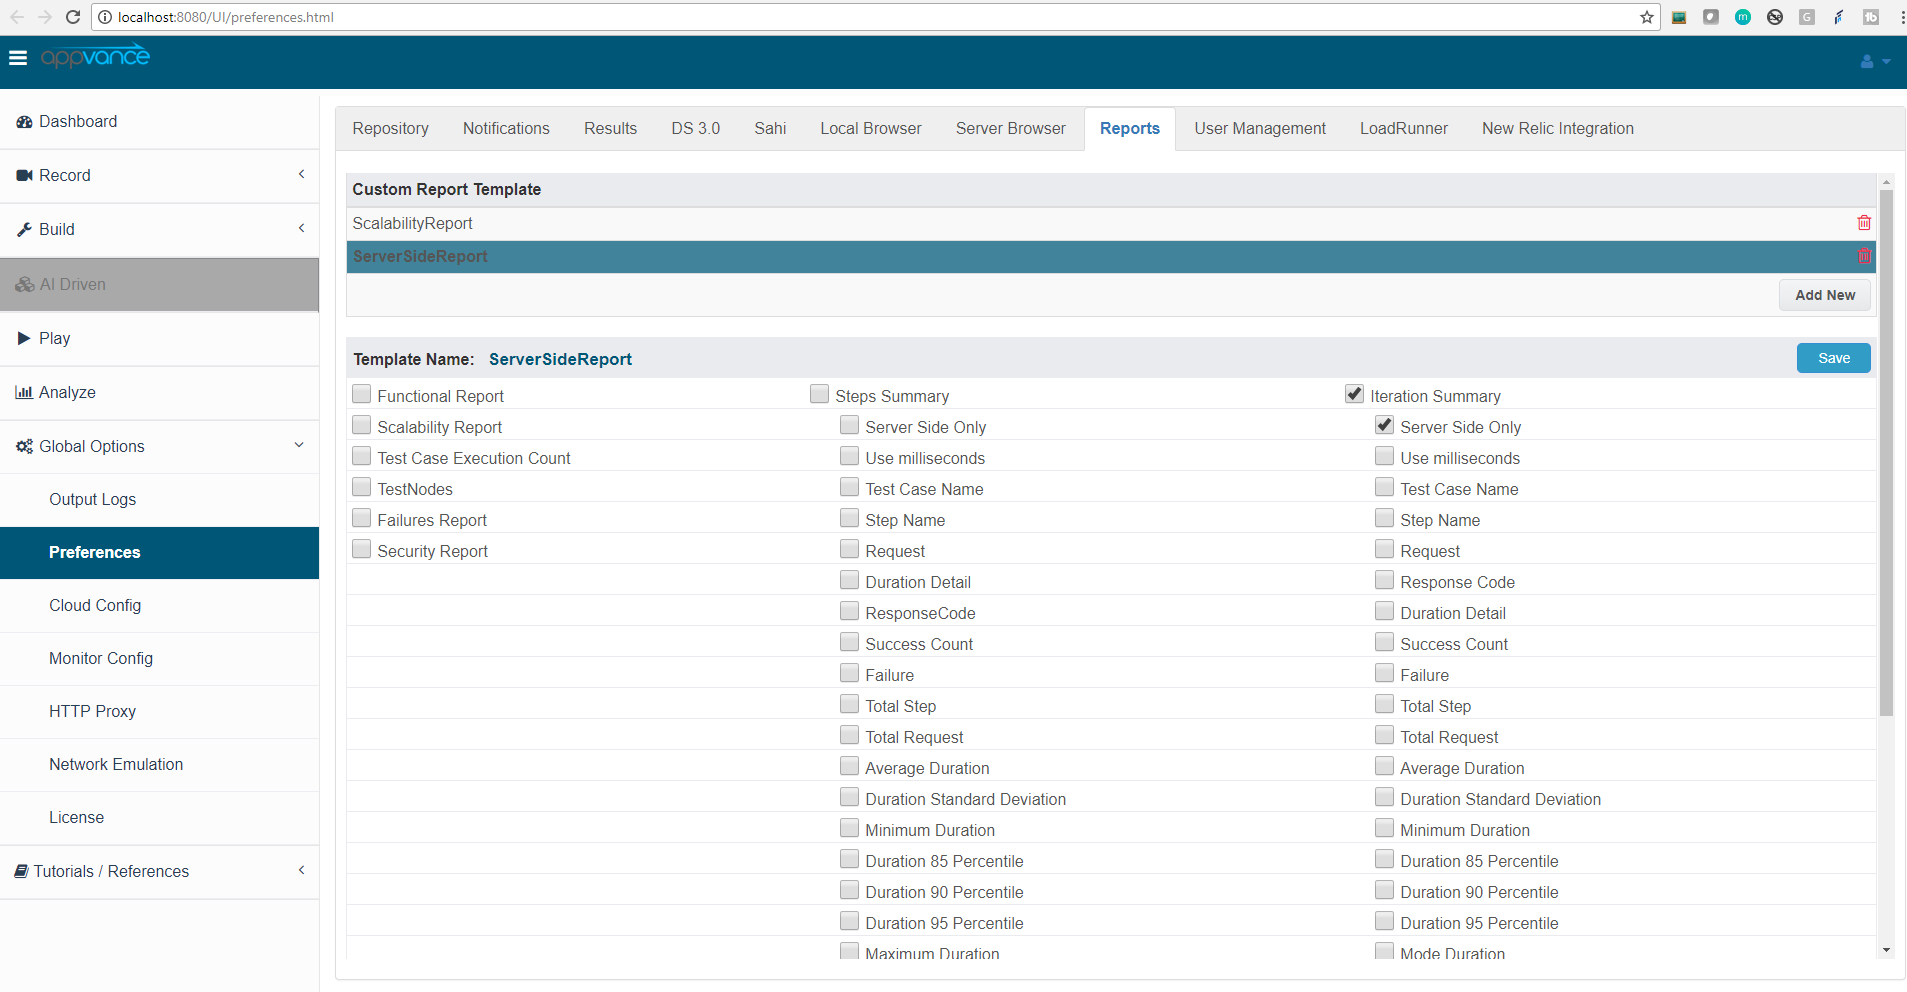
Functional reportUseful for functional testing. Shows first transaction detailed information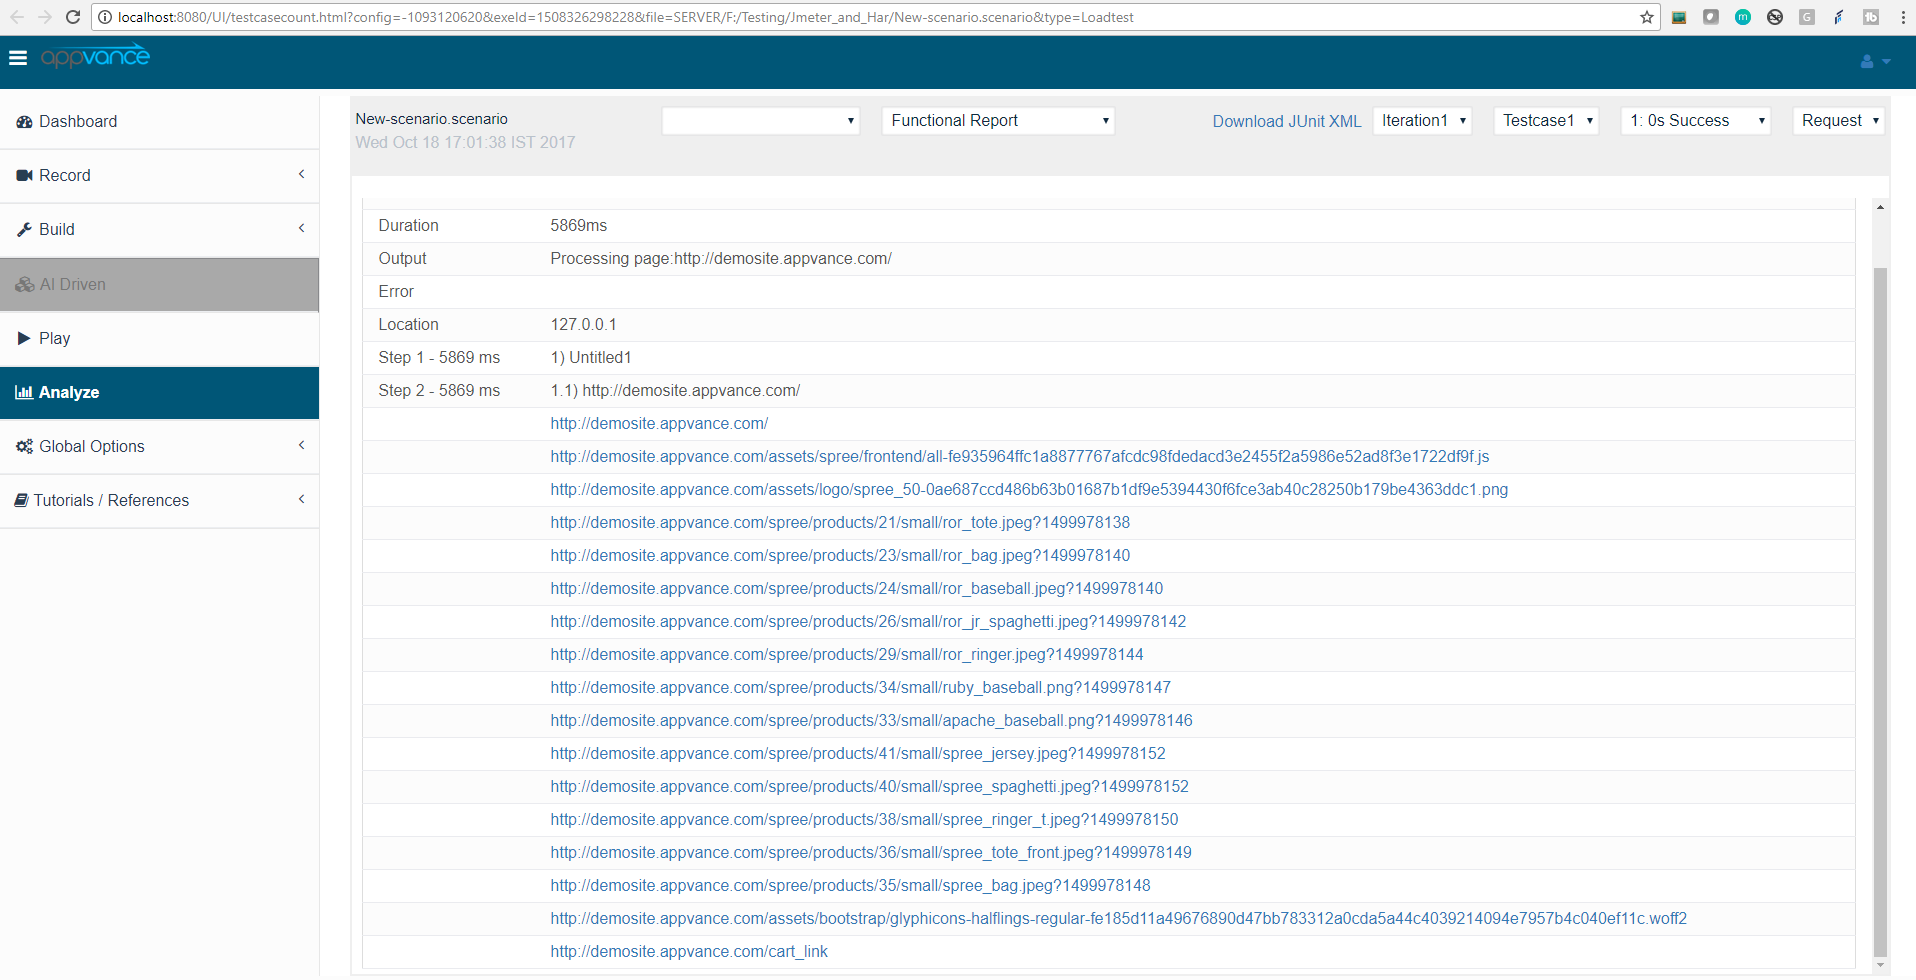
Scalability ReportScalability Report shows how the application scales during the test. Scaling means the more users use the service, the moretransactionswillbeforebedrawingachieved.Scalability Report is provided in Transactions per second (TPS for short). Good environments should have linear scalability, meaning if X user generates Y transactions, N*X users will generate N*Y transactions.Automatically shows the expected Linear Scalability vs the actual Transactions Per Second achieved.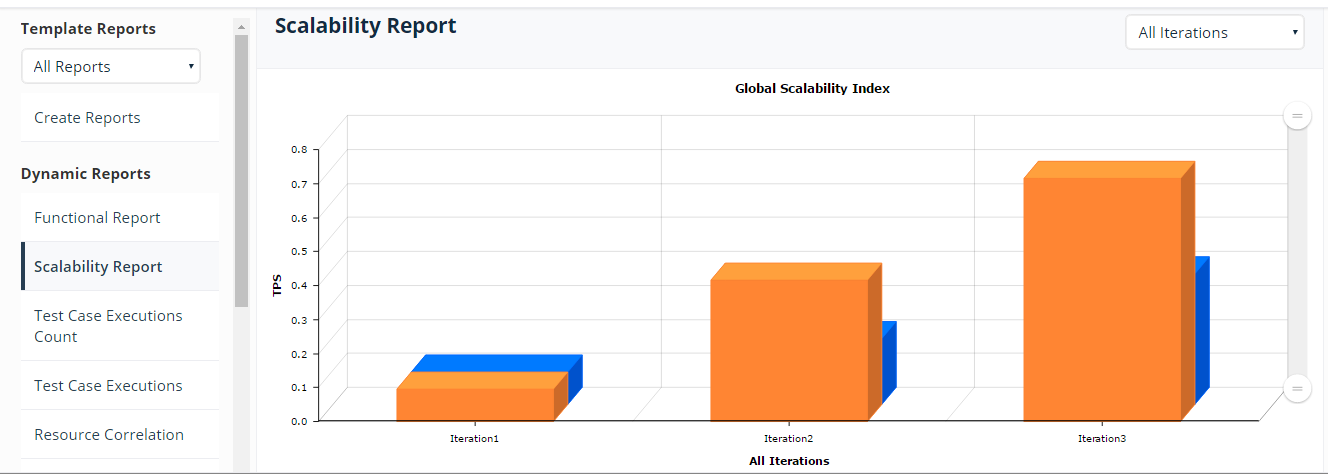
TestCase Execution CountTestCase Execution Count Report shows total successful transactions versus total failures transactions. Each Iteration can be selected from the drop-down.It is useful to quickly see if there are spikes in failures and the overall performance of the service.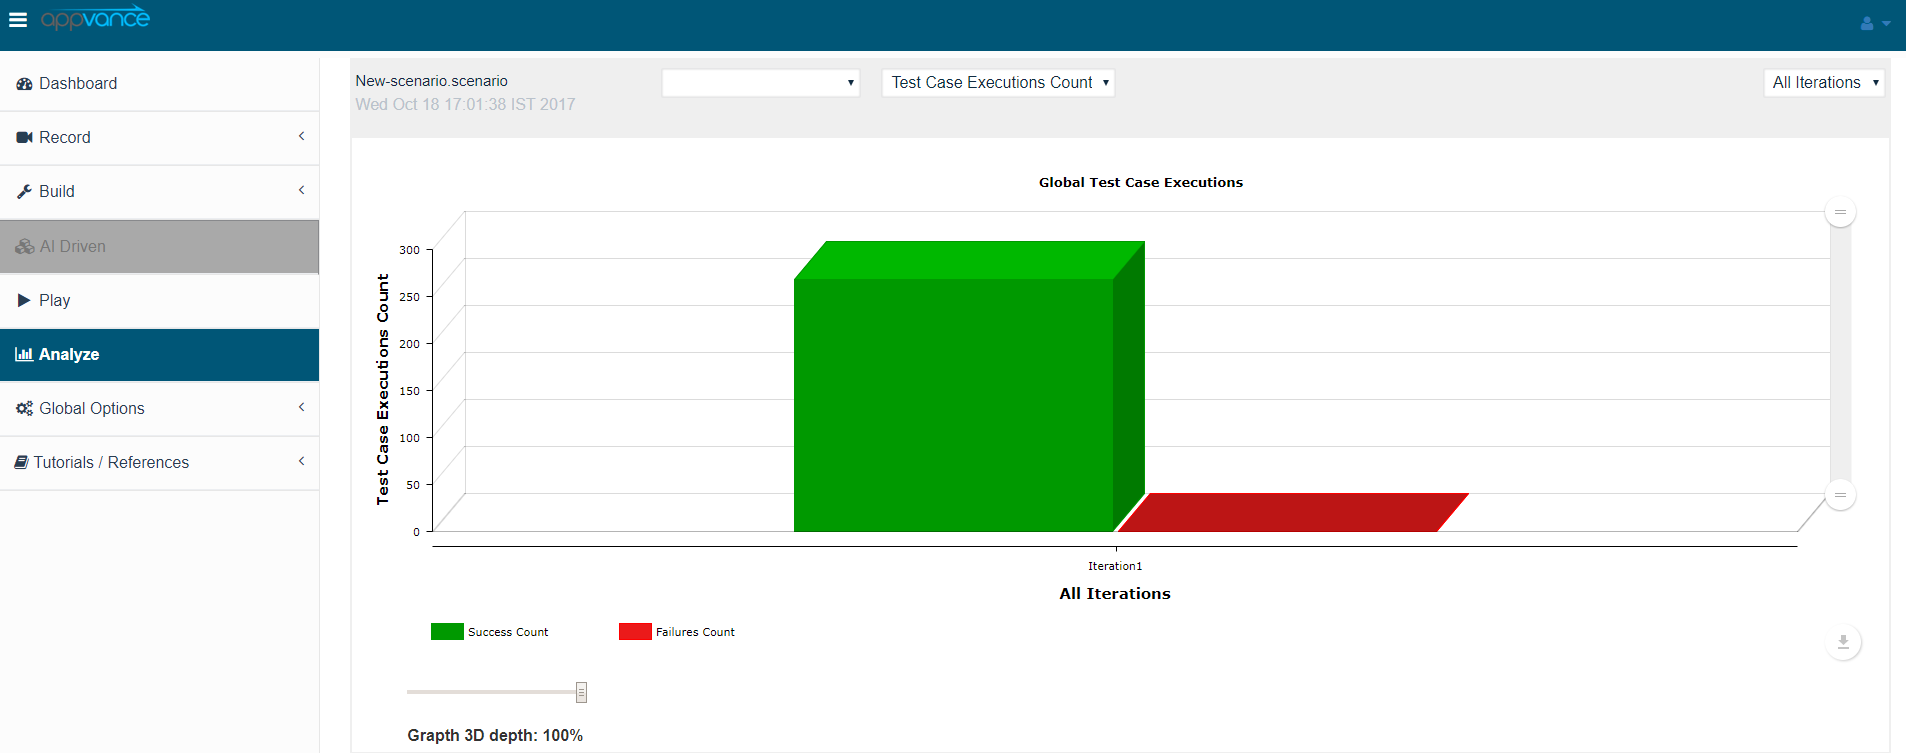
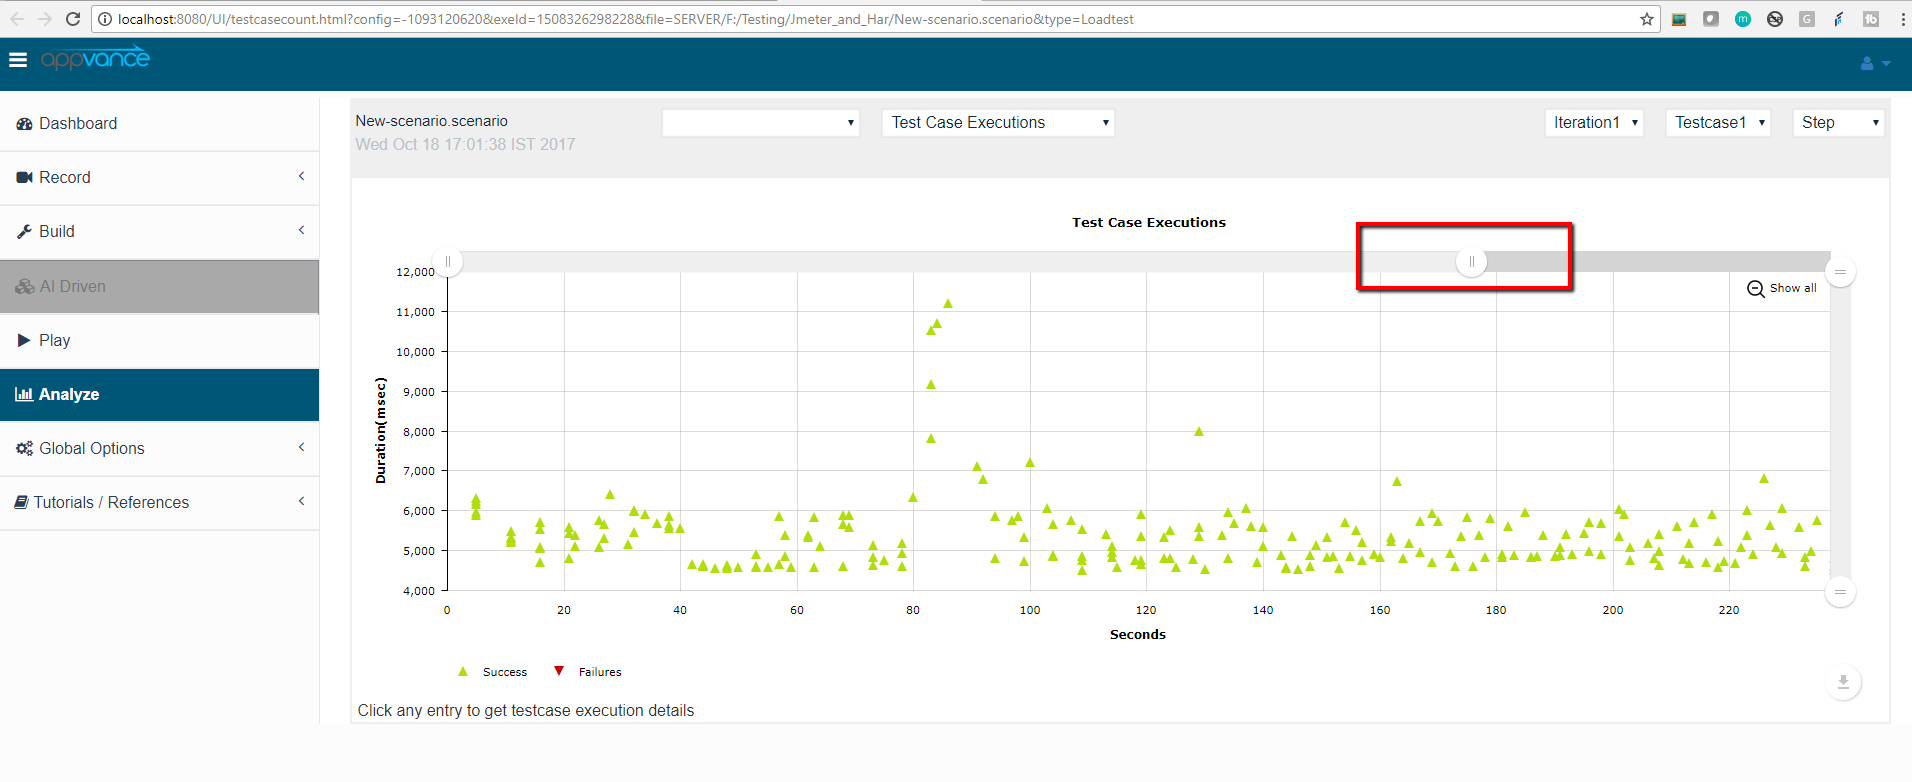
TestCase ExecutionTestCase Execution Report shows transactions duration every iteration. Iteration needs to be selected from the drop-down as well the Test Case.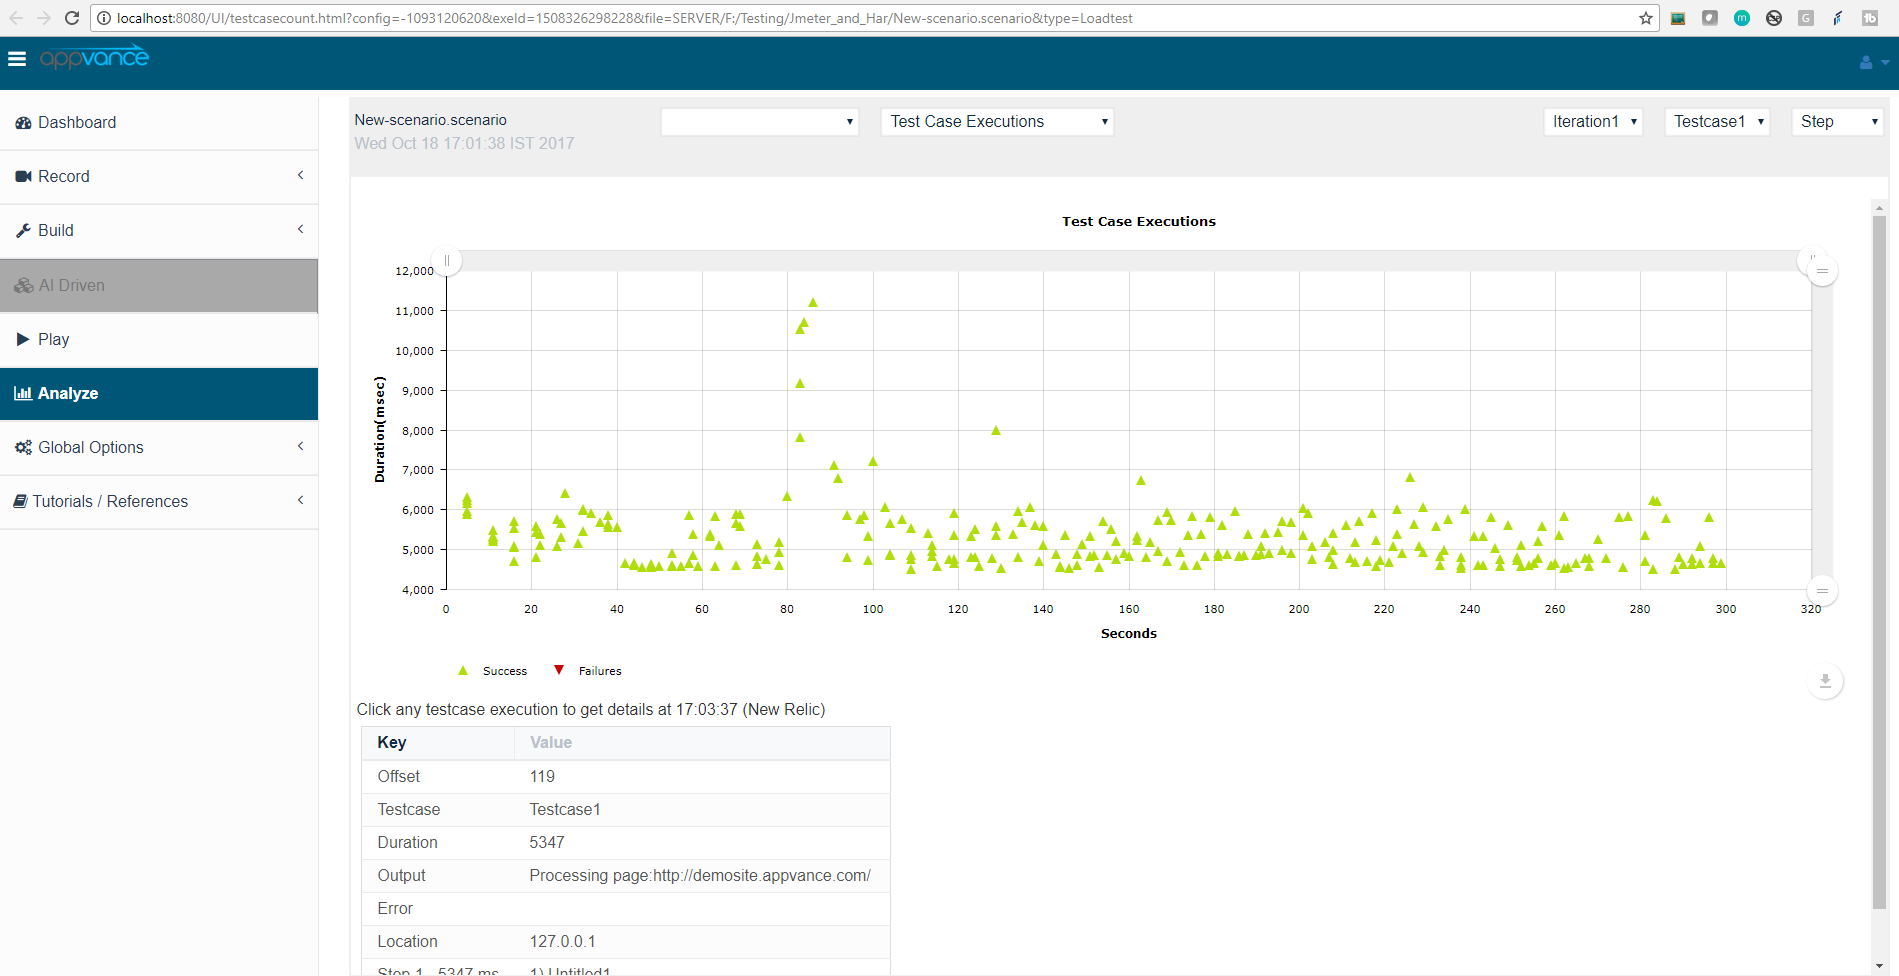
Resource correlationIn order to add machines, a UTPMonitor service should be installed on the desired machine.Appvance IQ support APCMonitor for Windows, Linux, and Mac Operating Systems.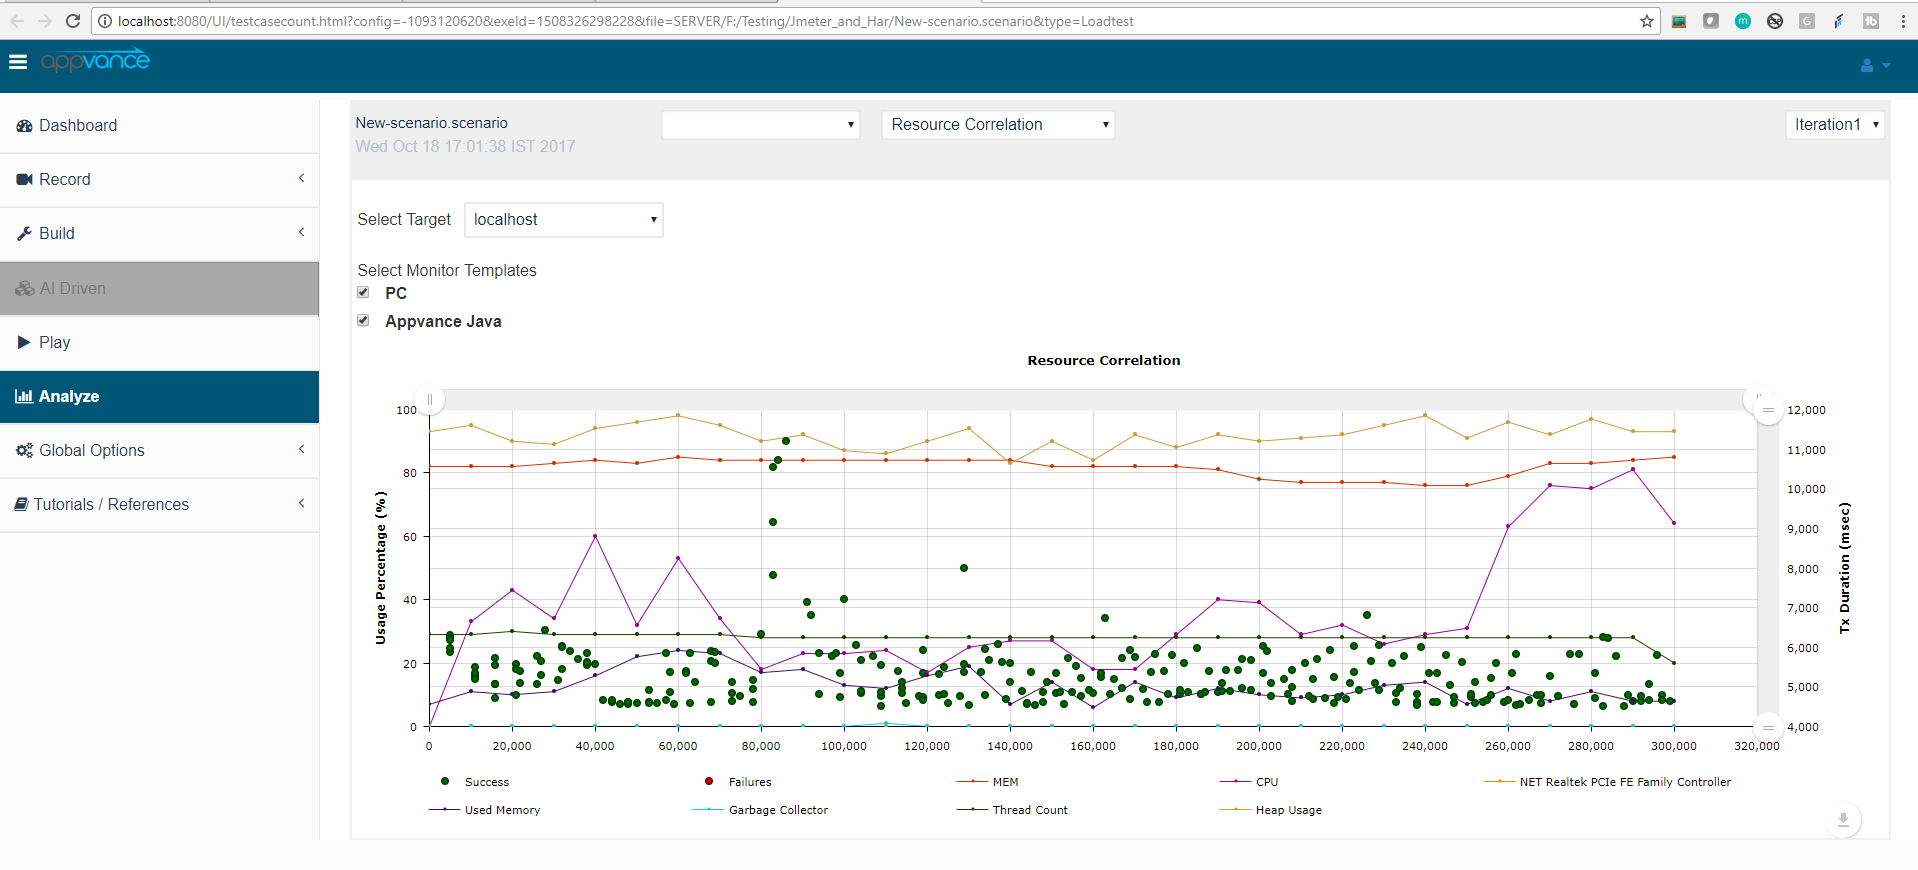
Resource UsageResource usage Report shows machine resource uses during a test. It is useful to pinpoint bottlenecks on a machine. Several machines can be added for resource monitoring. AIQ recommends adding monitors to all the machines that are used during the test. They might include databases, web servers, load balancers, etc.In order to add machines, an APCMonitor service should be installed on the desired machine.AIQ supports APCMonitor for Windows, Linux, and Mac machines.JVM METRICS:Heap UsageThis is a JVM metric that shows the used Heap Memory. The heap memory is a run-time data area from which memory for all class instances and arrays are allocated. AIQ by default initializes the heap size limit as 1500 Mb.
Garbage CollectorJVM Garbage Collector is a process that automatically handles disposing of memory is no longer used. This metric shows the CPU usage of this process.
Thread countShows the current number of active threads in JVM
OS METRICS:CPU UsageCPU usage as reported by the operating system.
MEMPercentage of memory used (against total memory) as reported by the operating system.
NETNet traffic as reported by the operating system.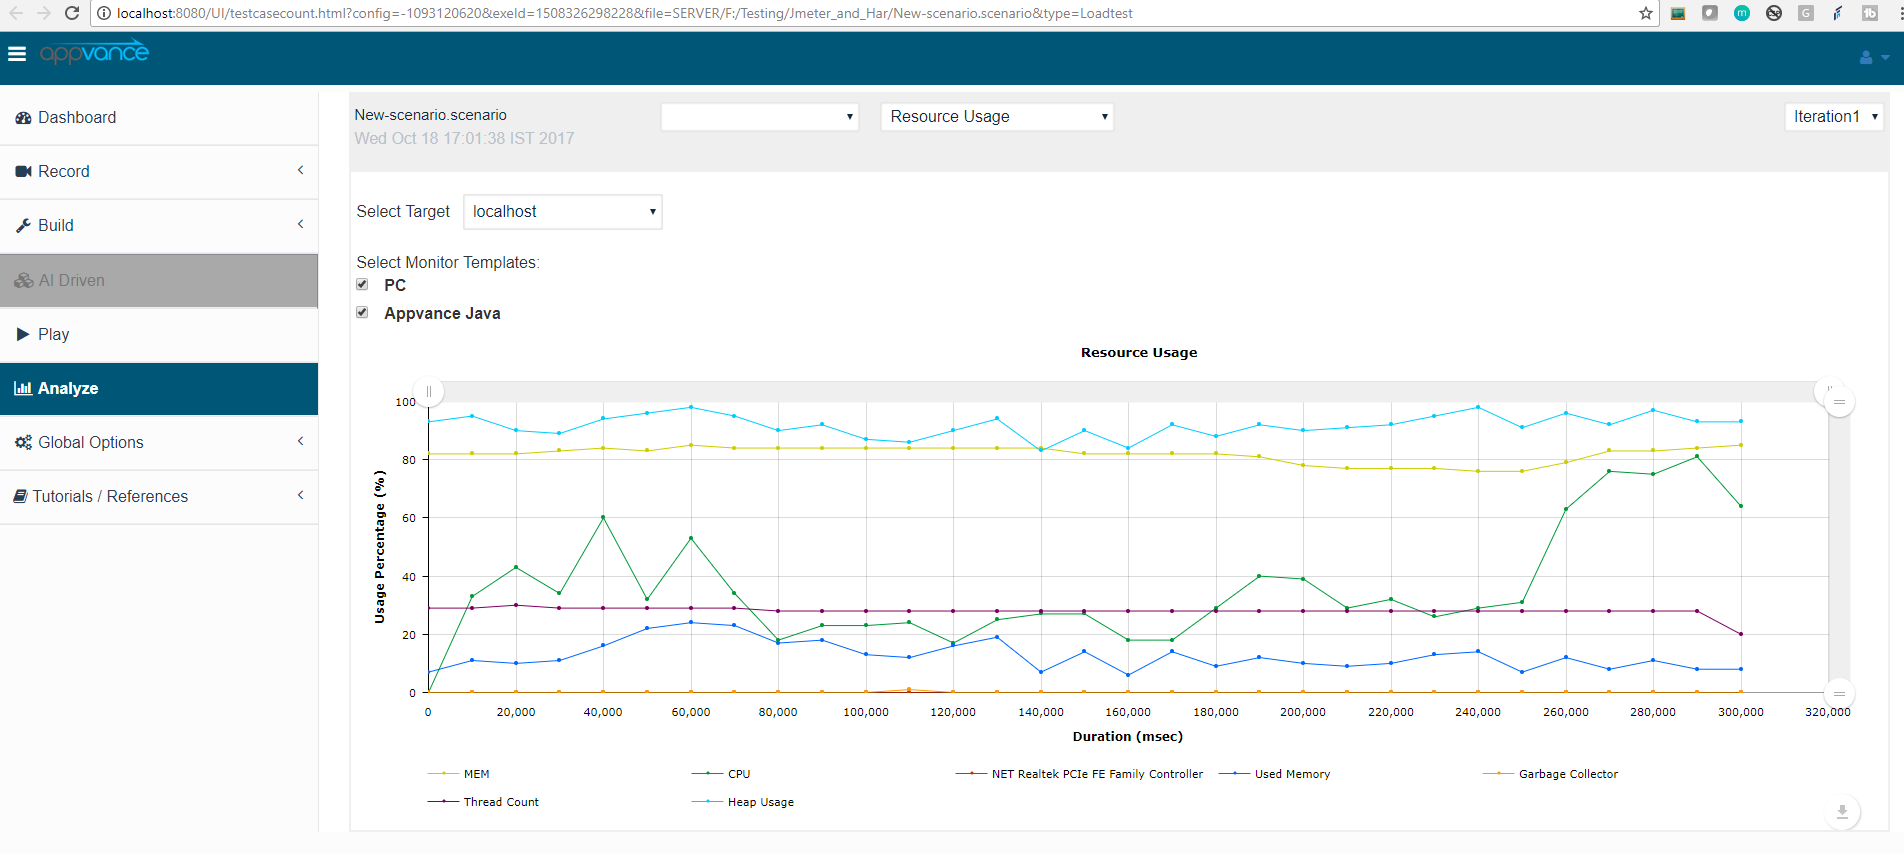
Results on TimeResults on Time graph gives you the option of choosing the "Element type" with "Metrics" that are available in the drop-down. Element type contains Test Case, Step, and Request whereas Metrics drop-down contains Size related, Count related, and duration related. Users can select the combination from either 2 and create a graph.In addition to the graph, the user can also download CSV reports depending upon theCompare metricsselected in the "Results on Time" Graph. If the user has selected Duration-related metrics the user can download CSV reports of Avg duration, min duration, and so on. So the CSV reports can be downloaded depending upon the metric selected.The data points for response times and hits/sec are calculated from the total number of executions for a specific time slice (granularity value). The granularity value is automatically chosen, depending on the duration of the test.For example, if the chosen granularity value is one minute, then the system will create an average. response time value, by averaging the response times of Test Case executions occurring every minute. This graph is useful to monitor the state of each Test Case, while the test is still running.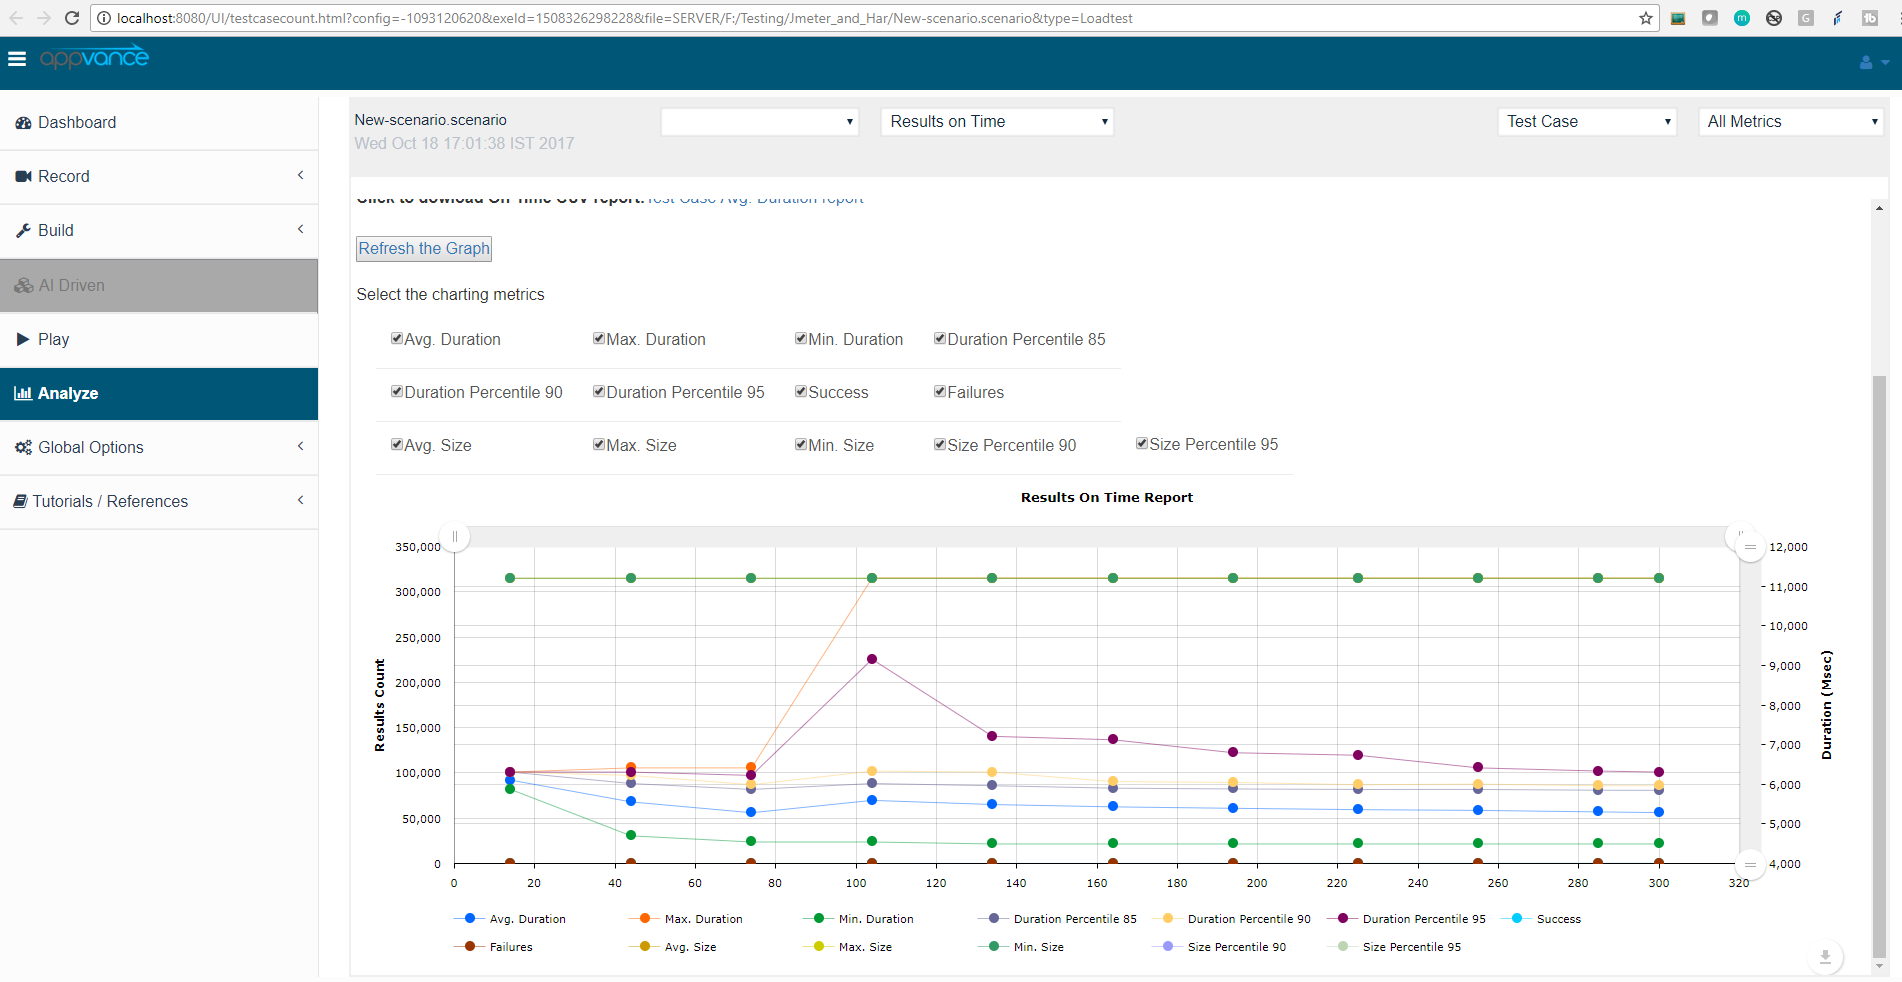
TestNodesTestNodes report shows quickly the output and error of the execution TestNodes. It might be useful for debugging purposes.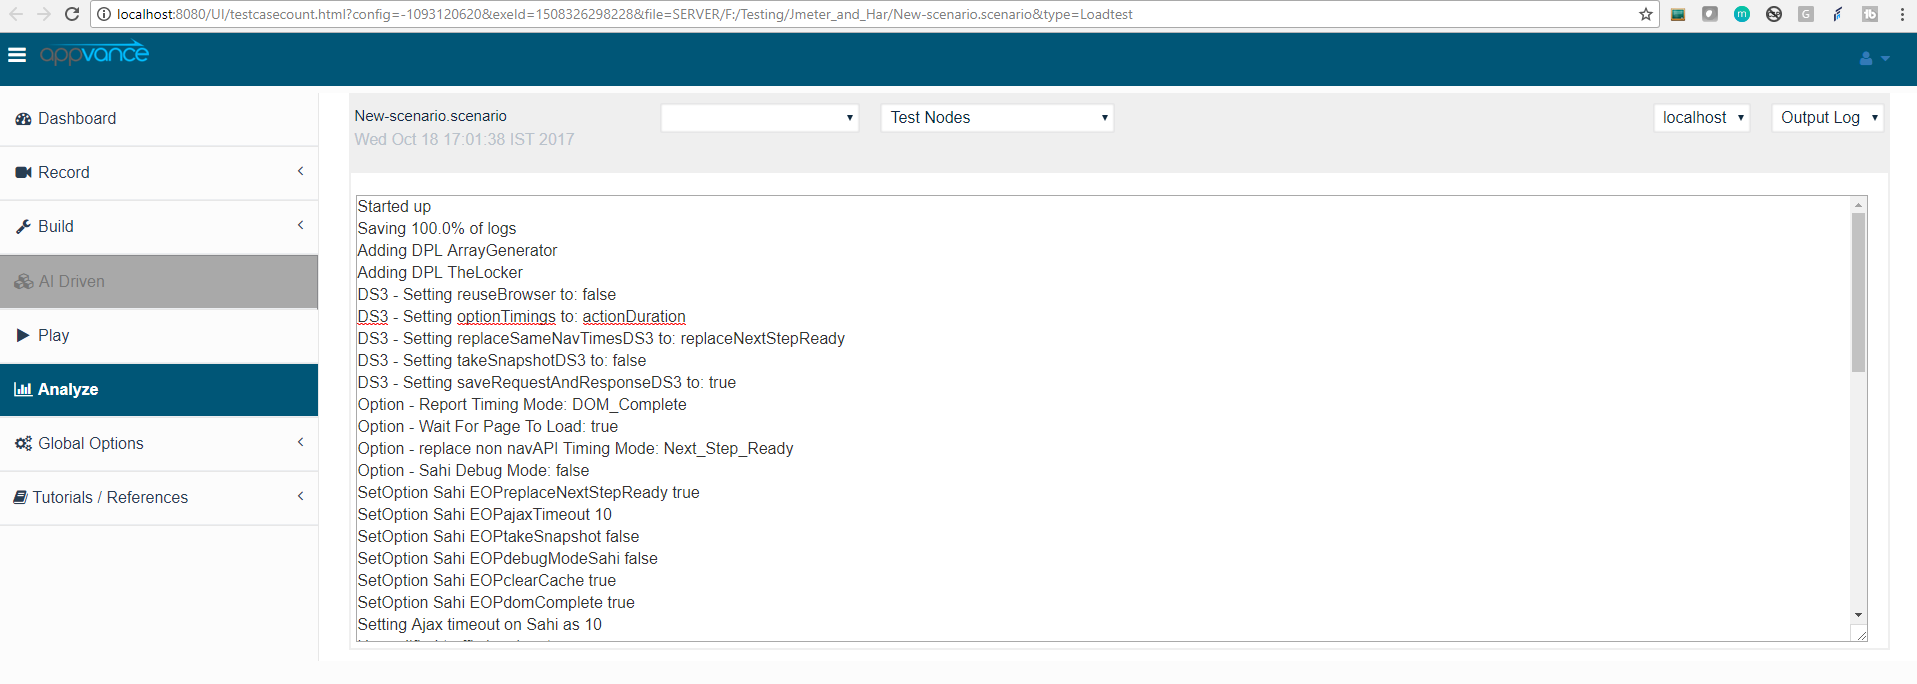
Step TimesStep Times Report shows transaction's step information per Iteration. The step information showed is the maximum, minimum, average step time. It also includes the duration standard deviation.Finally, it shows the 85, 90, and 95 duration percentile. This means the maximum duration of 85, 90, and 95% of the steps. It is useful to set limits and confirm them. E.g. 90% of login steps should take less than 10 seconds.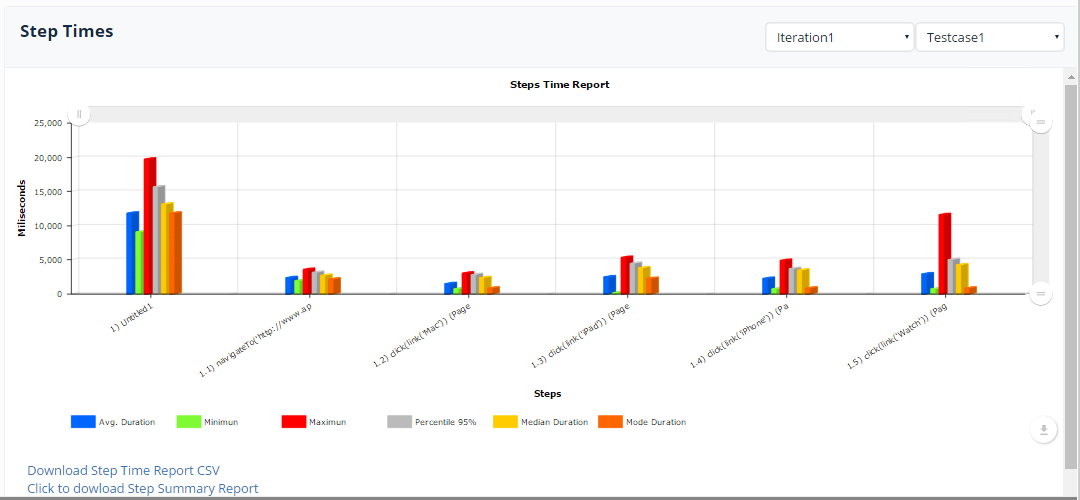
Step Times CSV ReportUnified Test Platform also provides a CSV report of the step times. It can be opened in almost any spreadsheet editor.Note: In order to capture total throughput in the CSV Report, Error logging should be enabled at the Options panel.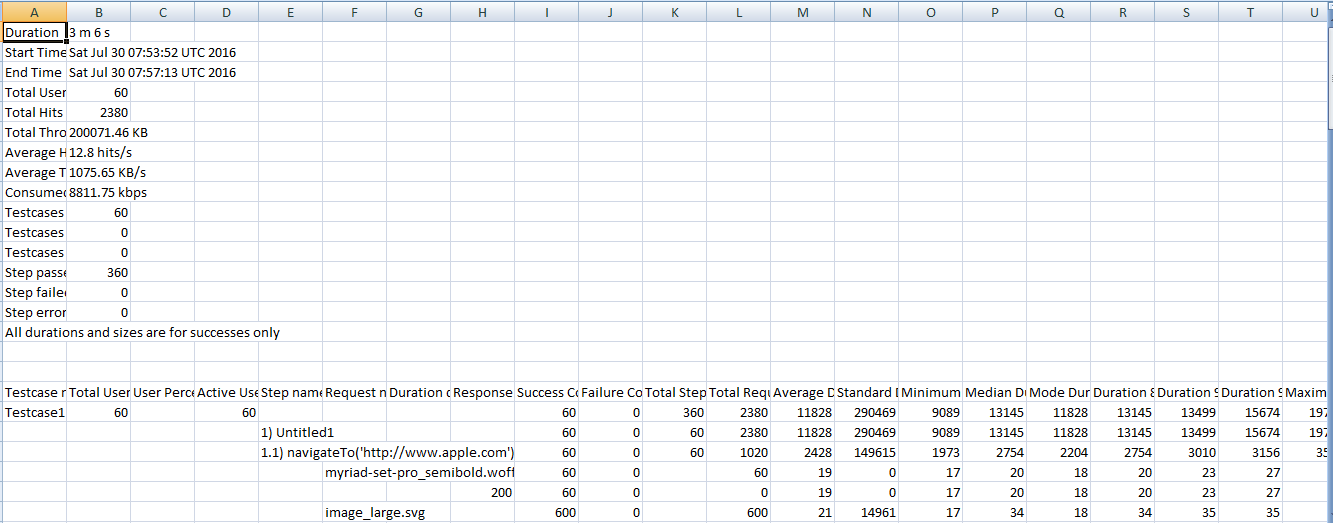
Step Summary ReportUnified Test Platform also provides a CSV report of the Step Summary. It can be opened in almost any spreadsheet editor.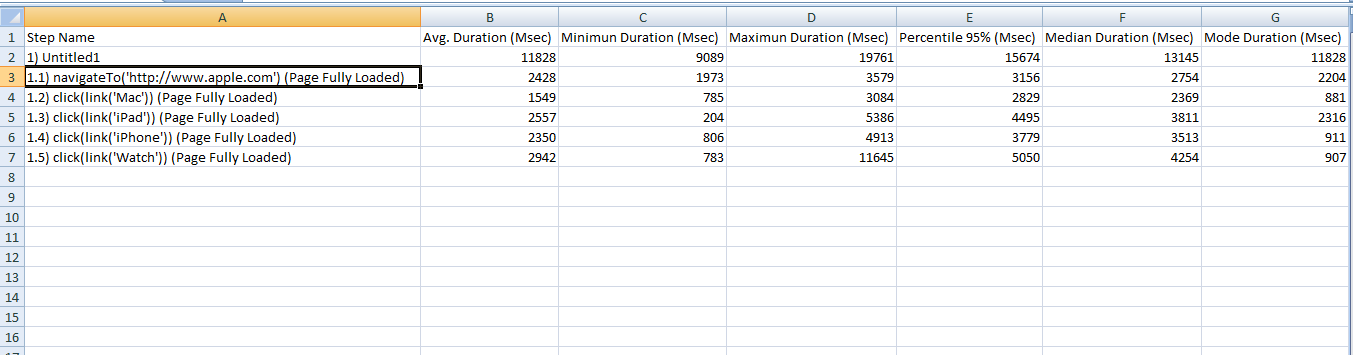
Location-Based ReportUnified Test Platform also provides a CSV report of the step times based on each location. It can be opened in almost any spreadsheet editor. There will be a separate link to download the CSV report for each location available.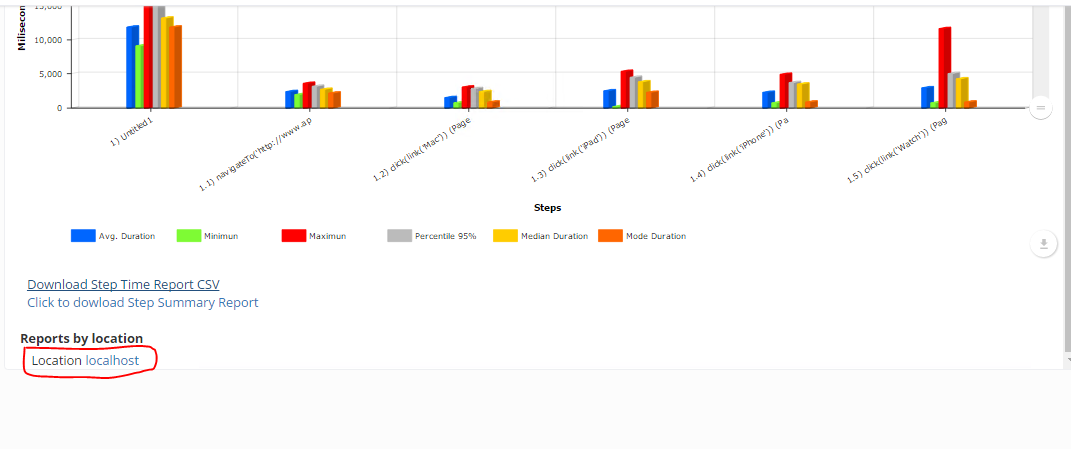
Clicking on the location link will download the location-based report in CSV format as shown below.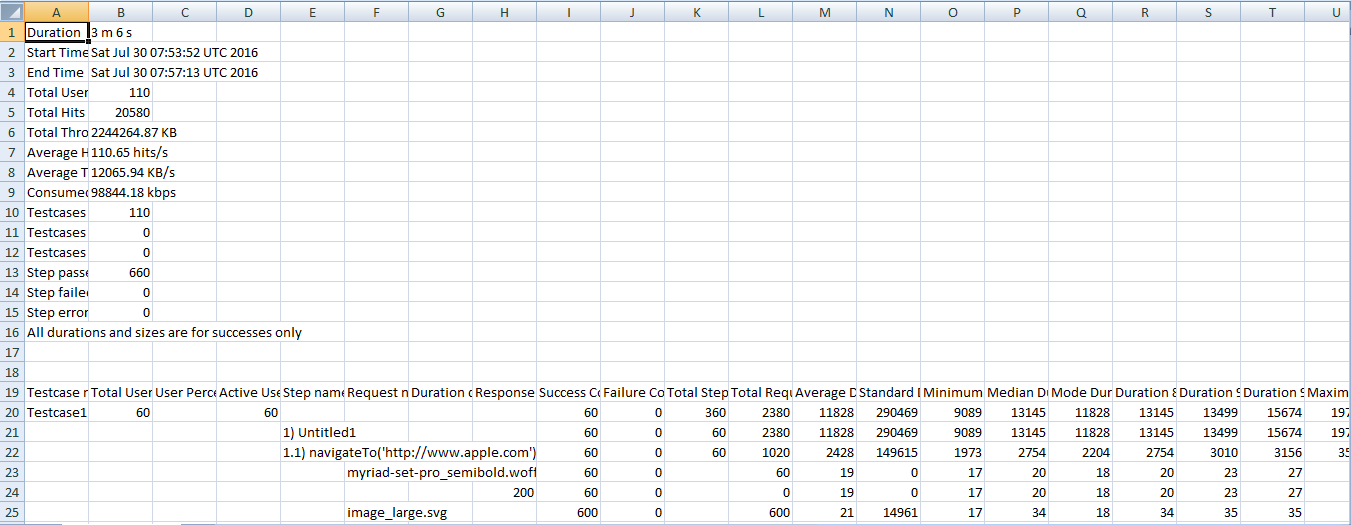
Note: In order to capture the location-based reports, the User has to enable the locations by going to the Test Cases tab and selecting "Users by Location" and assigning the users in each location.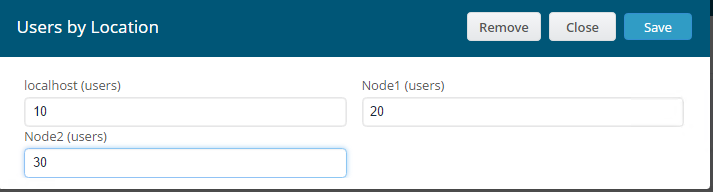
Downloading GraphUnified Test Platform also provides a feature wherein the user can download the step times graph make changes to the graph like annotate etc.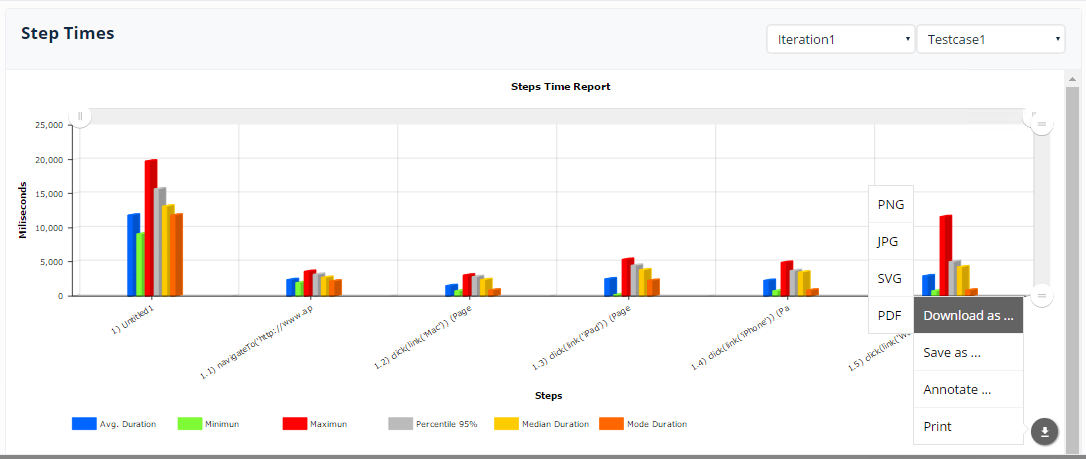
Failures reportFailure report shows the number of successes and failures from all the iterations (Scenario wise). Just like the step times report, a bar graph is shown with the list of successes and failures.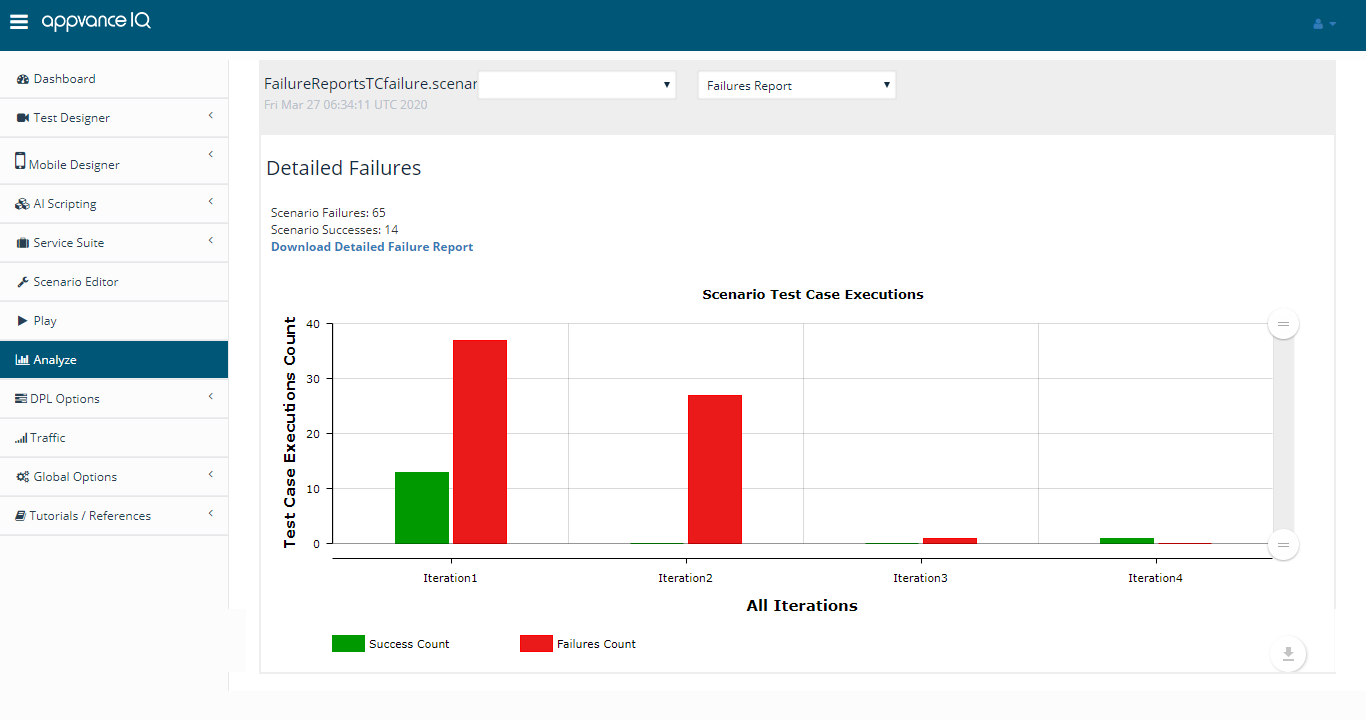
To check the failures in detail, you can click theDownload Detailed Failures Reportlink which will download an HTML report showing all the required data in detail.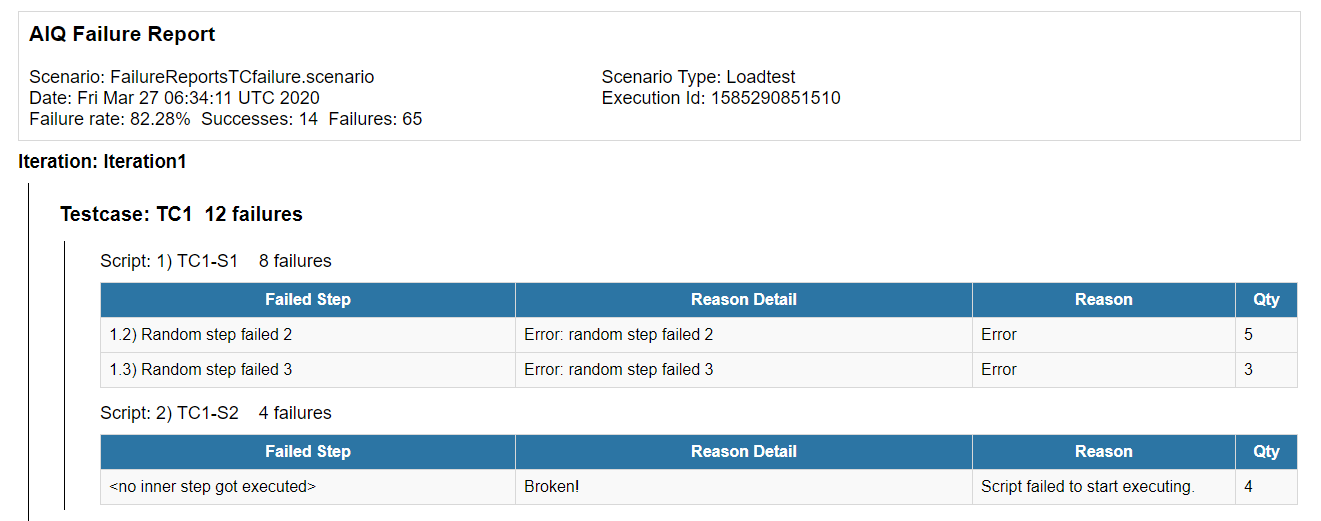
Iteration SummaryIteration Summary is a CSV document that shows execution information during the iterations.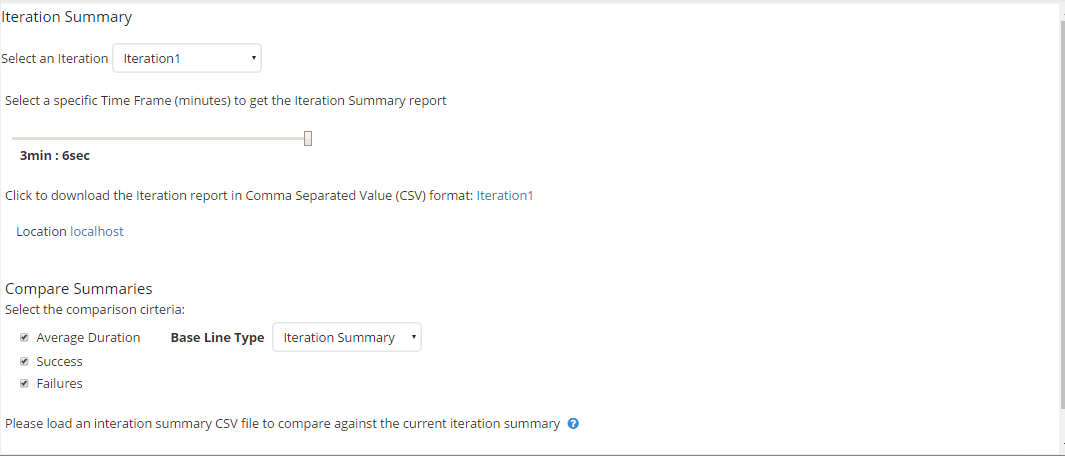
The iteration summary is the most complete report. It contains several rows showing each Test Case with the total transactions achieved, the total failures, and success. It also contains the average, maximum, minimum, and average duration of each Test Case and the Standard deviation.It also indicates the number of users who executed each Test Case during the iteration.Also, it shows the 85, 90, and 95 percentile of each transaction. This means the maximum duration of 85, 90, and 95% of the transactions per Test Case. Percentile is useful to set limits and confirm them. E.g. 90% of Test Case "Working Sequence" should take less than 10 seconds.Finally, it shows all the above information for the iteration as a whole and not only its Test Cases.
Compare SummariesThe iteration Summary tab also allows the user to compare the reports of the same test that was run previously. This helps to compare the changes in response times.By default, the comparison takes place between the current execution and the execution which was run previously.The screenshot of the UI is shown below.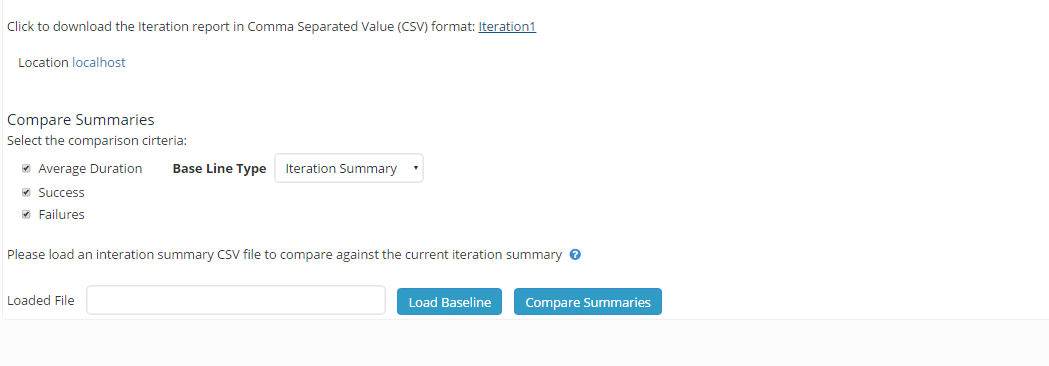
The user loads theagainst baseline andclicksacceptanceonthresholds. - Export
CompareorSummaries and ashare reportinlinksHTMLaccordingformattowillprojectbereportingopened which gives the comparison between executions.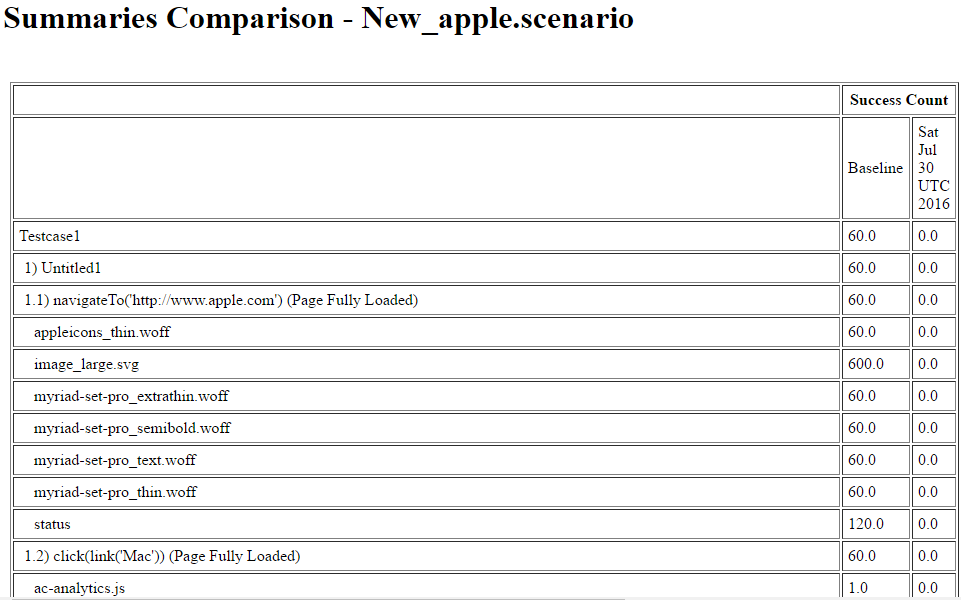
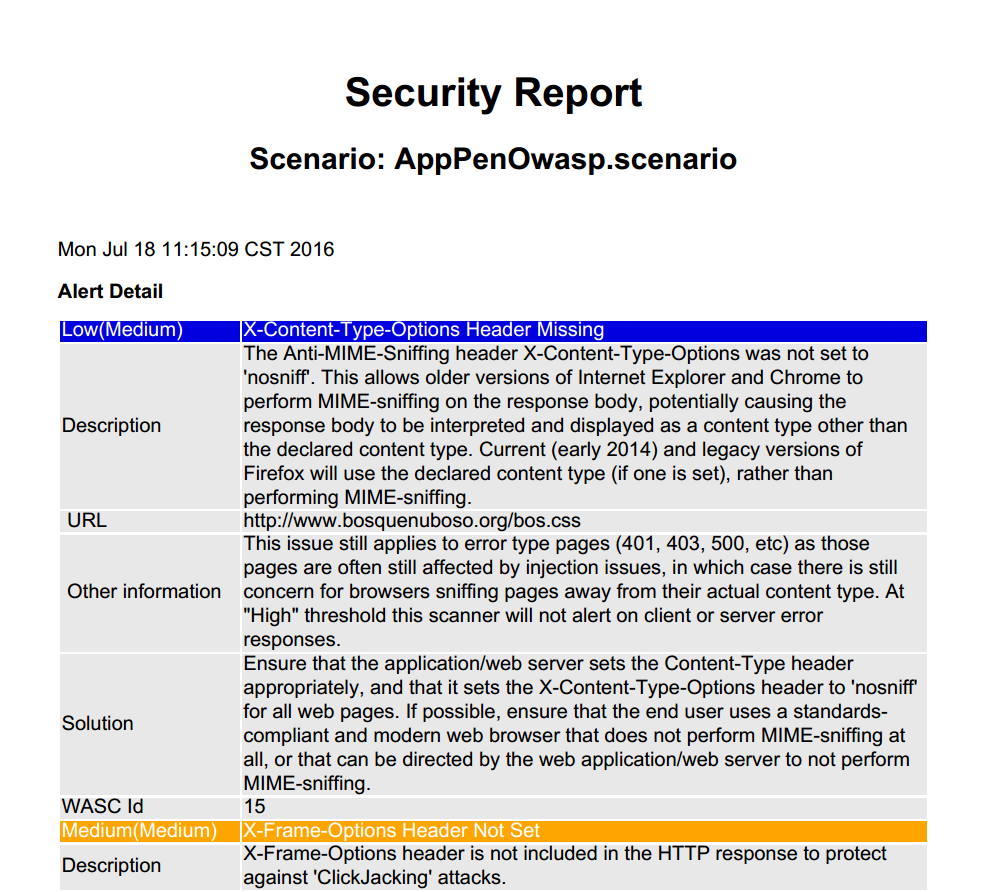
policy.Security Report
TheNote: securityA report tab is only available whenever you execute an App Penetration test type, another kind of scenario will not display this tab since there will be no report available. Thissingle report is generatedevidence, basednot onroot thecause. ZAP OWASP open-source tool which is included in AIQ as one of our engines to perform web security tests. It is a formatted PDF fileCorrelate with thelogs, list of vulnerabilities of a website returned by OWASP.
All about requestsmonitoring, and responses
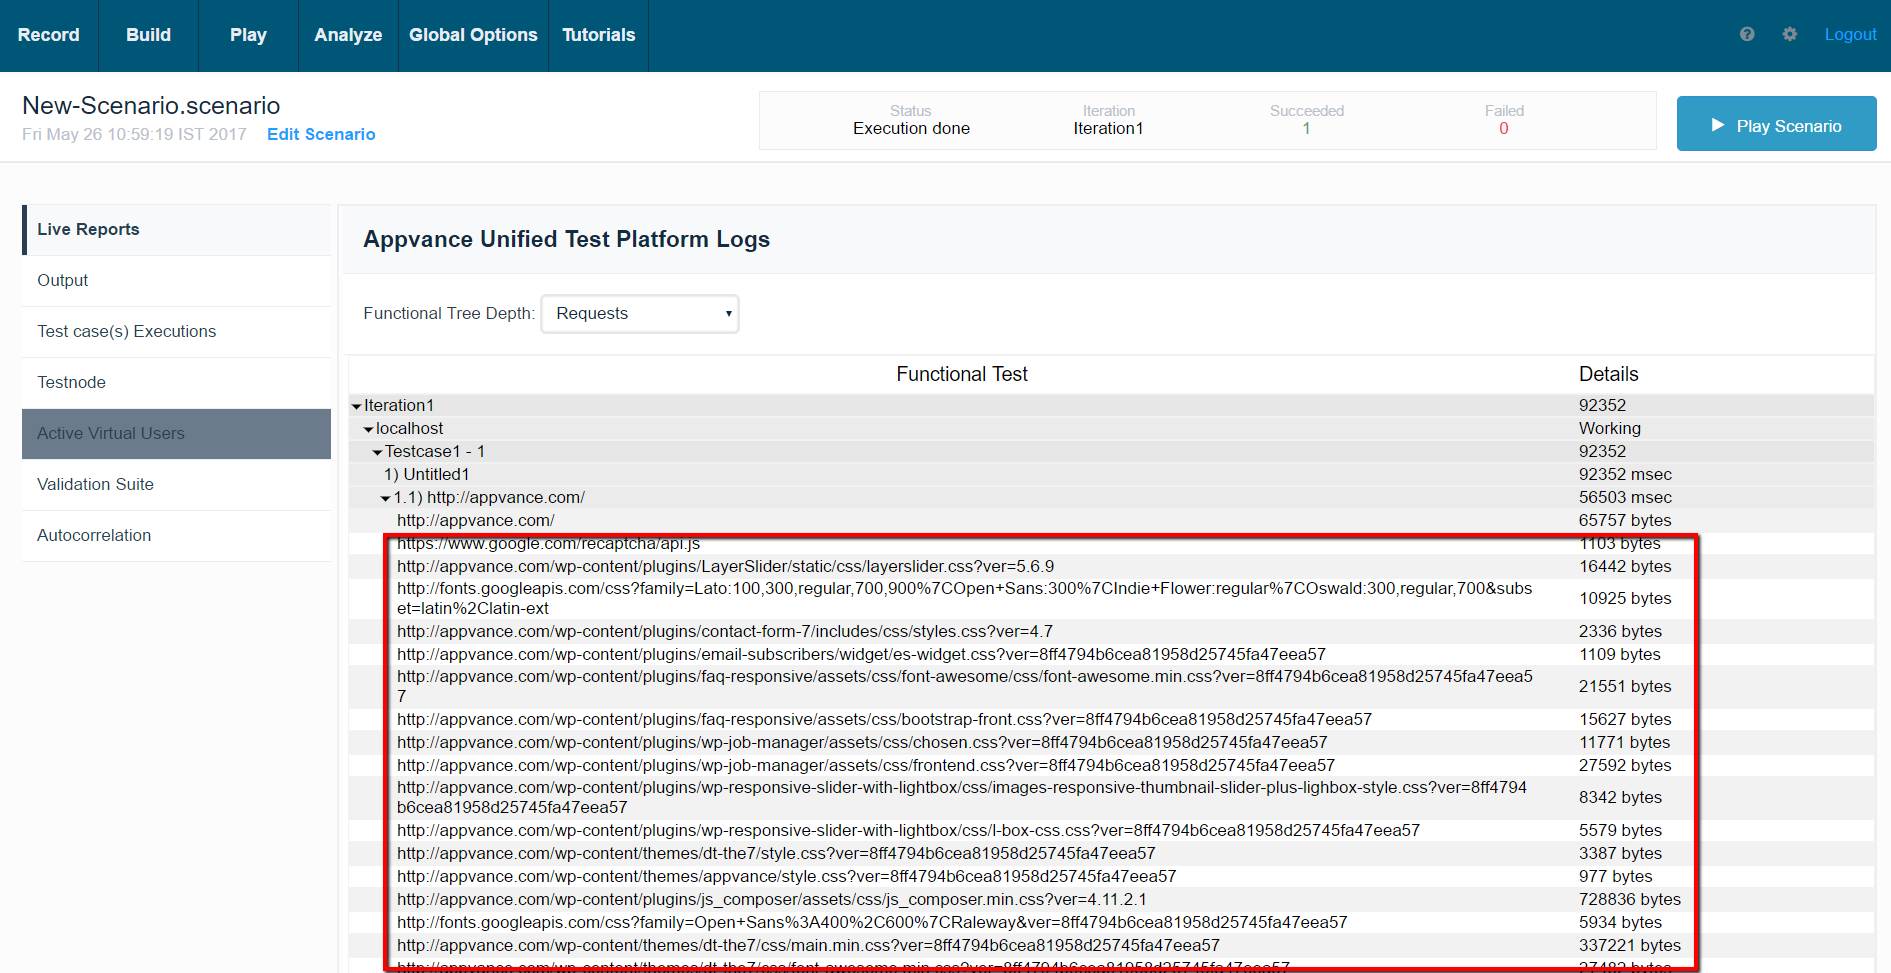
environment Below are some of the details of requests and responses.
All the links below a page are requests with size in bytes - This is in the controller window after running a test.
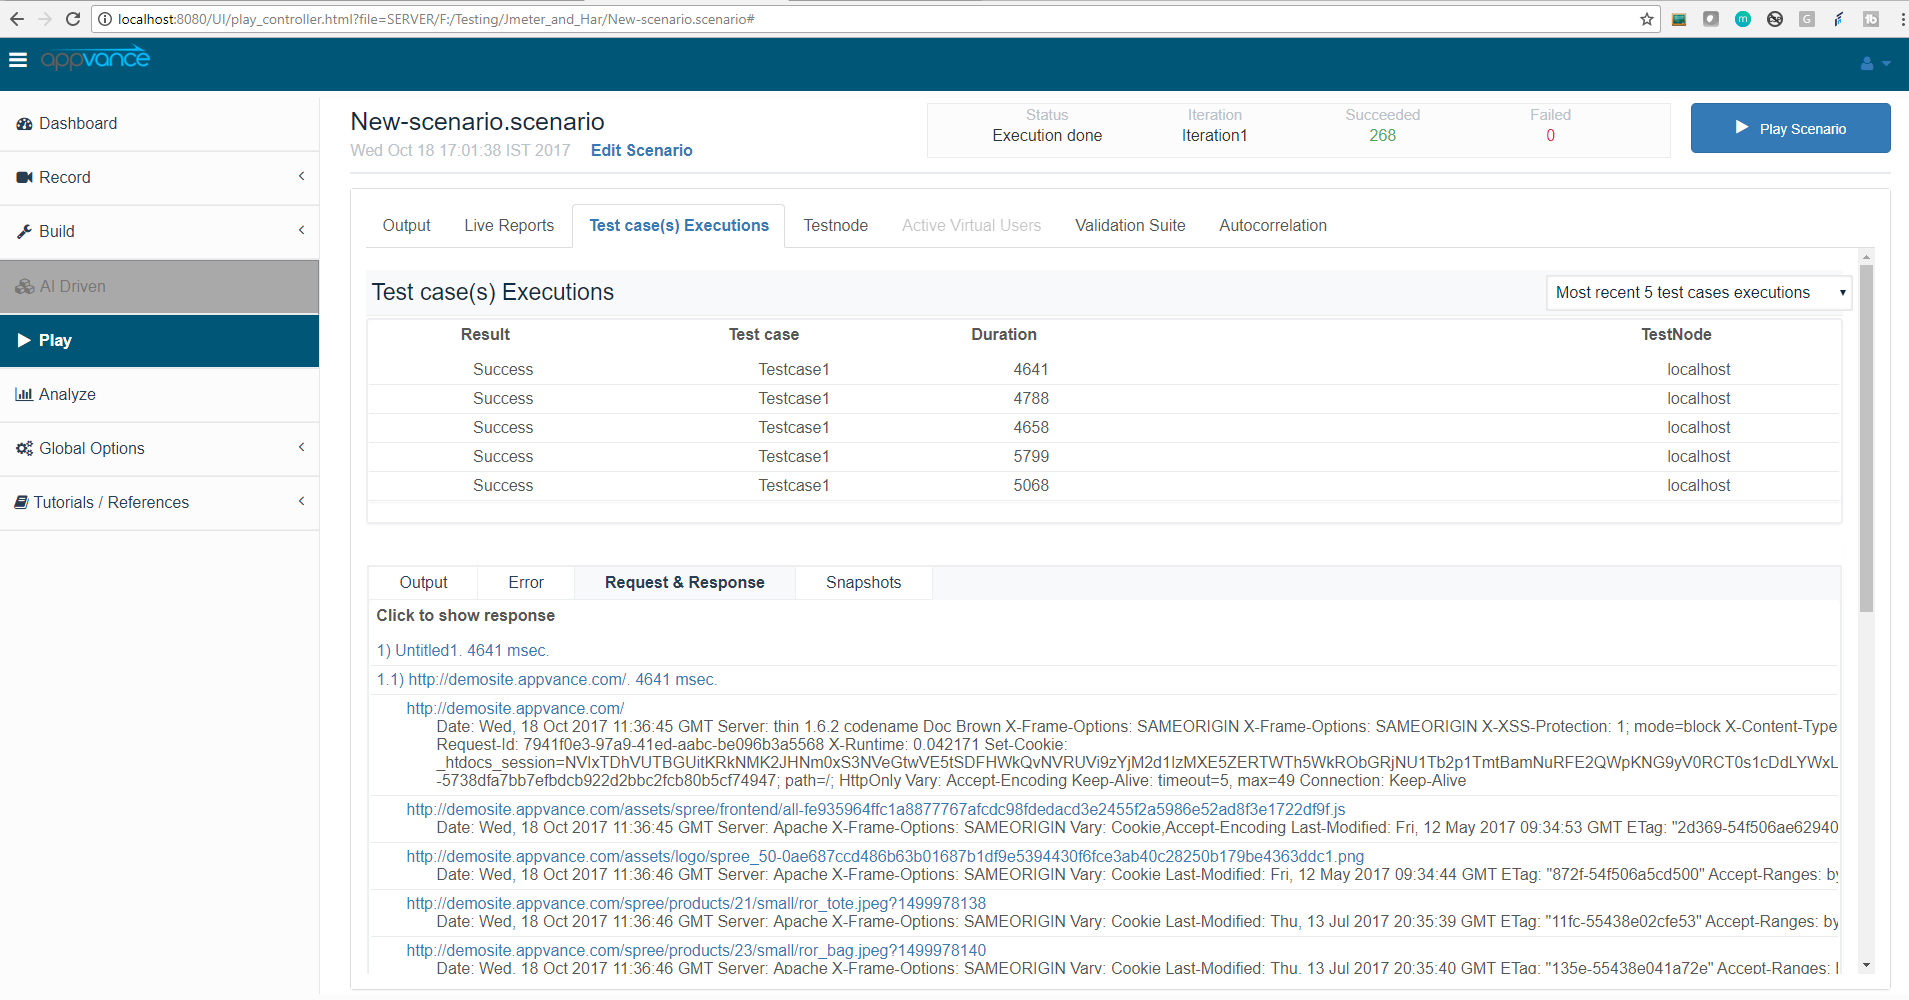
Test Case execution tab - Click success or failure transaction - go to request and response tab to see the list of requests and responses.
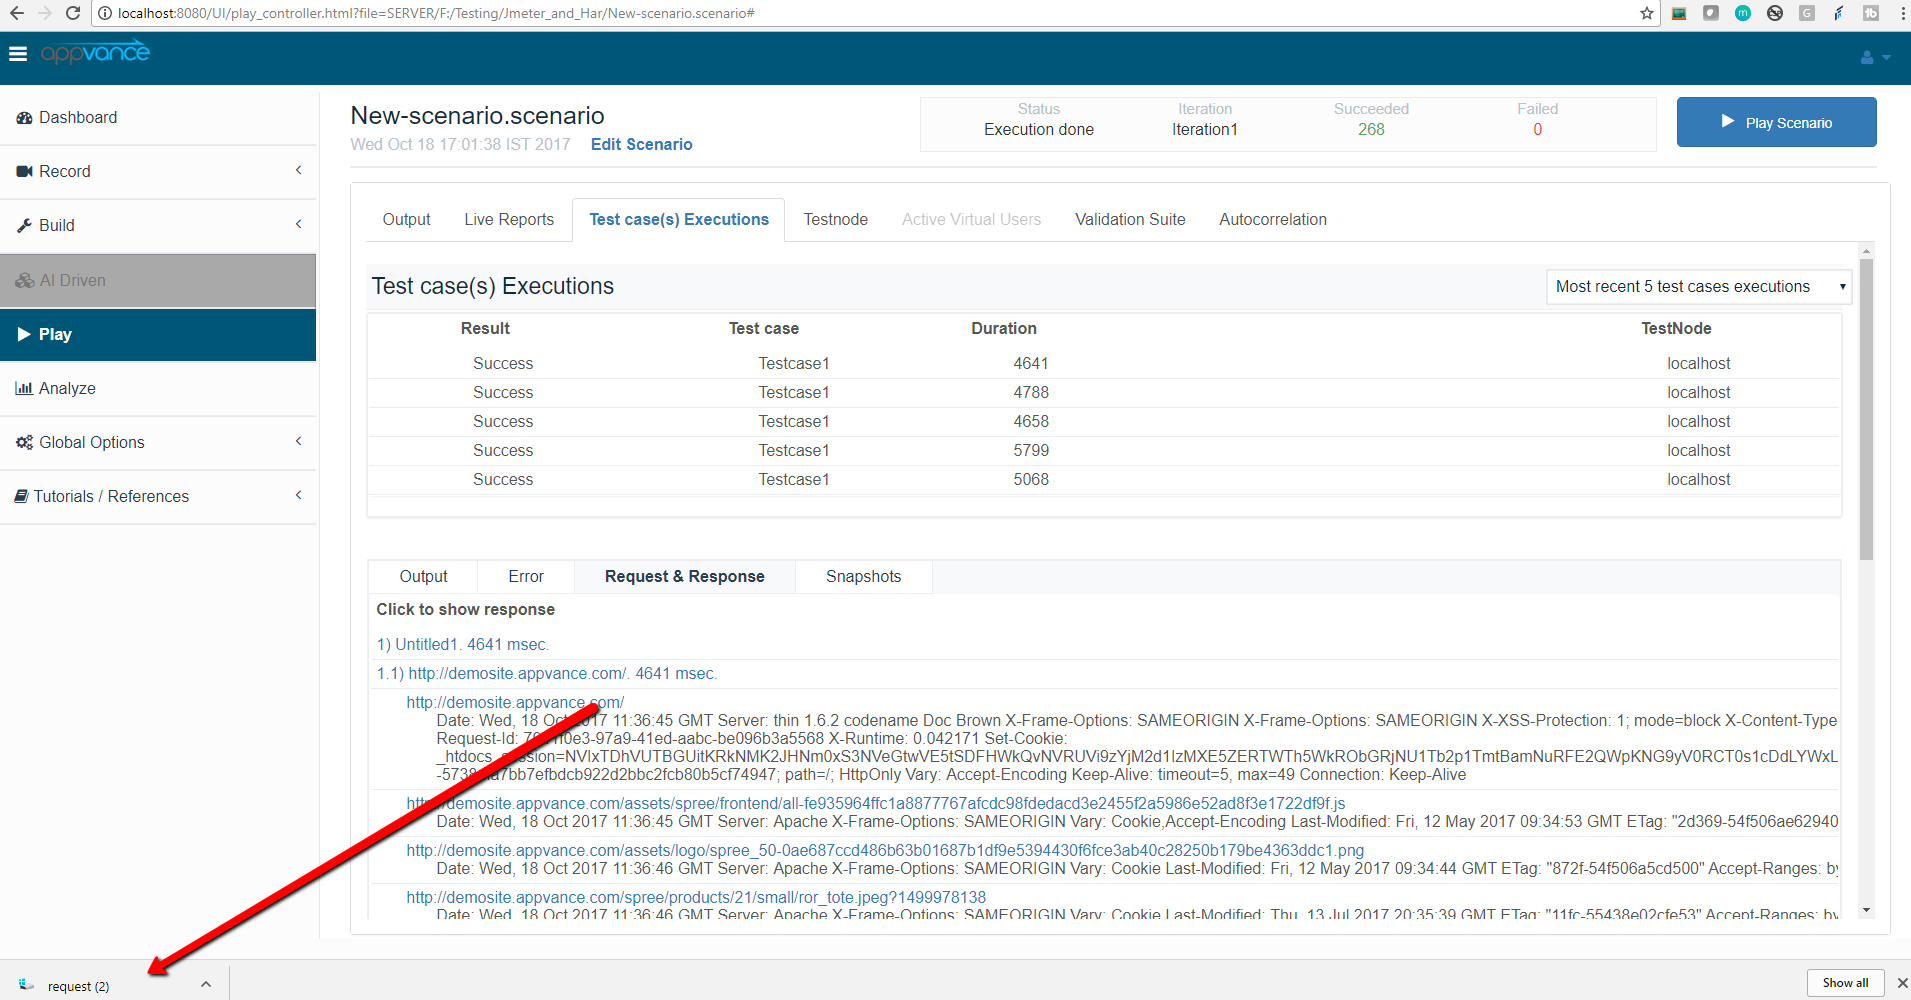
Clicking a request will download the response as seen below:
Report - Iteration summary report - provides details in a CSV sheet, This shows the request name, the response codes of each request, a number of occurrences of this request under a URL, what time it took to load that request (Average duration), the minimum and maximum duration is also provided in case of the performance load test.
Filter response content:
We also have the option to filter out the response contents to be stored in the database or not with this feature.
Visit Global Options for more details.
Plot Graphs:
We can use Results on time graphs to plot graphs based on a Request from a particular step.
There are a lot more that we could offer with requests and responses, but again since we have all these data with us, presenting them to the customer as they requested does not take much time for the Appvance team.
Assertions:
Assertions can be added to Requests as well, please refer to Validation and Store Test Suite - HAR for more details.changes.
Last updated: JulySeptember 10,22, 20232026
If you have any feedback on this topic, please contact us at documentation@appvance.ai.