
Transforming Calibration Results to TPS
Apps are increasingly used as part of marketing campaigns to engage customers in brands. Brand managers and business managers typically do not talk in terms of virtual users and transactions per second. For example, PepsiCo's brand manager for a Mountain Dew app promoting Halo 4 and Xbox knows how many customers will use the app after running national television advertising.
Brand managers typically understand the measurement of user sessions in a given period of time. For example, an advertising campaign will generate peak app usage of 6,000 user sessions in a 10 minute period.
Transform the virtual user charts above by determining the average transaction time. Divide by the test time. Then, multiply by the virtual user count. For example, a test with 60 second average transaction time, 5 virtual users, and 10 minutes of test time operate 50 transactions in a 10 minute period.
Formula: (test time in seconds / average transaction time in seconds) × virtual user count
Understanding TPS
Transactions Per Second (TPS) can be measured and may be counterintuitive. Appvance IQ shows a system's Scalability Index chart in the test results, displaying the system's throughput at four concurrent request levels.
Test Results of a System's Throughput at 4 Concurrent Requests Levels
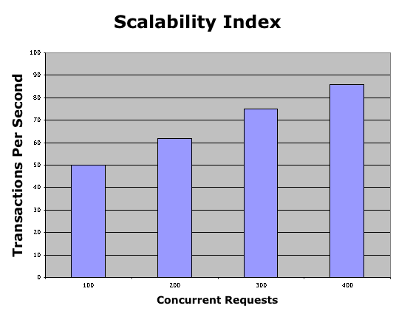
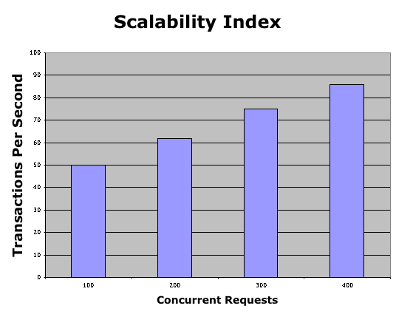
Figure 1: Test Results of a System's Throughput at 4 Concurrent Request Levels
System throughput is measured as the number of transactions a system handles as more requests are received. A perfect information system handles requests at a constant rate regardless of the number of requests; it increases its transactions per second to maintain a constant response time. Charting a perfect system's scalability shows the TPS rate increasing in equal proportion to the number of received requests; it is a linear relationship.
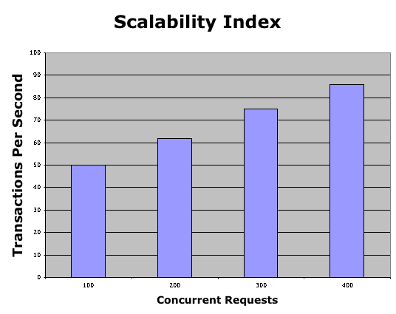
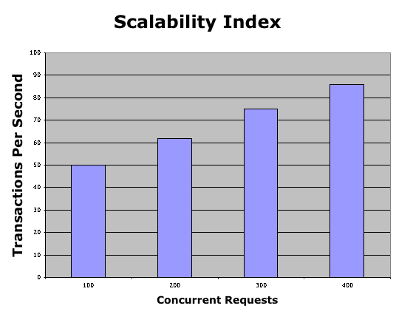
Figure 2: Linear relationship of a perfect system
For instance, if a perfect system handles 100 concurrent requests in 10 seconds with a 2 second response time, then maintaining the 2 second response time, it should handle 200 concurrent requests in the same 10 second period.
Scalability Index for a Perfect System
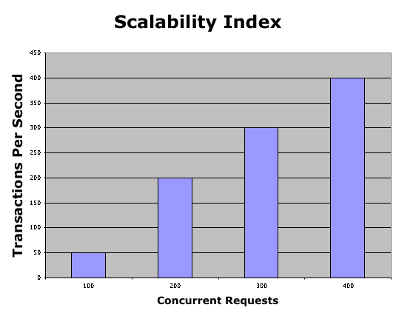
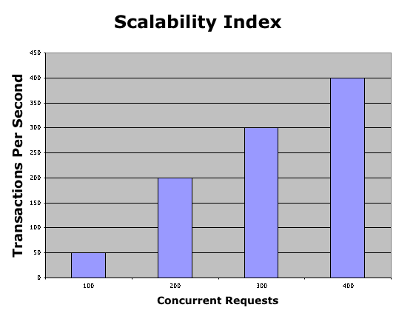
Figure 3: Scalability Index for a Perfect System
At each concurrent request level, the system handles requests at a measured rate in transactions per second, yielding the system's response time. As concurrent request levels increase, the system handles requests at the same rate, so the number of transactions increases in equal proportion. TPS keeps going up and to the right in equal proportion to the number of requests.
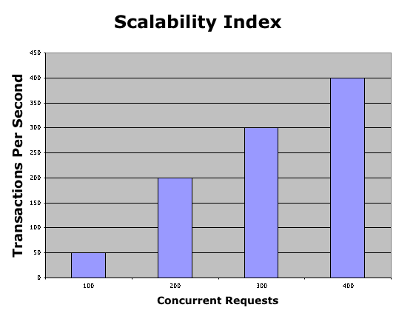
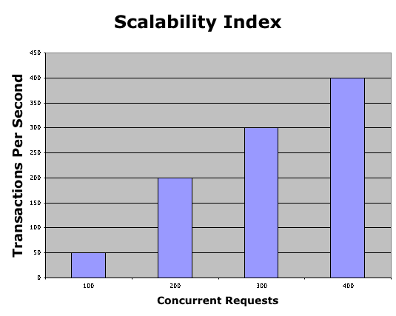
Figure 4: TPS increases in equal proportion to requests
For instance, with 100 concurrent requests, a system handling 1,000 requests in a 10 second period yields a handling rate of 100 transactions per second. The same system at 200 concurrent requests handles 2,000 requests in the same 10 second period, increasing the handling rate to 200 transactions per second. That is perfect scalability - the Holy Grail of performance testing. Receiving more requests does not slow down the overall system response time.
However, a typical system hitting a bottleneck behaves differently.
A Service Exhibiting a Performance Bottleneck
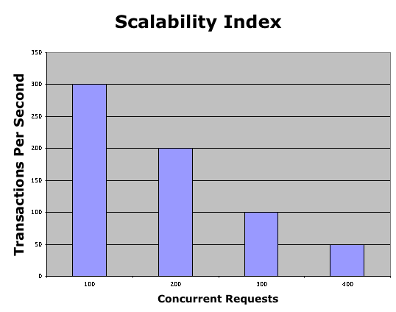
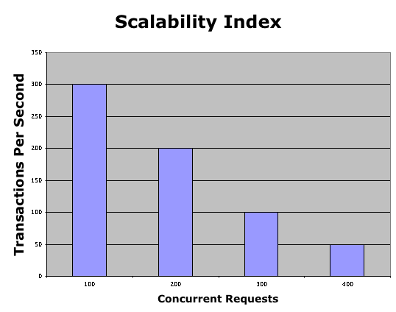
Figure 5: A Service Exhibiting a Performance Bottleneck
As the system receives a larger number of concurrent requests it slows down when responding to each request. Increasing past 400 concurrent requests, the system would eventually reach zero transactions per second. Many systems checked for scalability have this problem. The Scalability Index helps system managers plan system capacity to achieve the desired throughput needed to keep user efficiency constant while helping developers understand how their design and coding decisions impact performance.
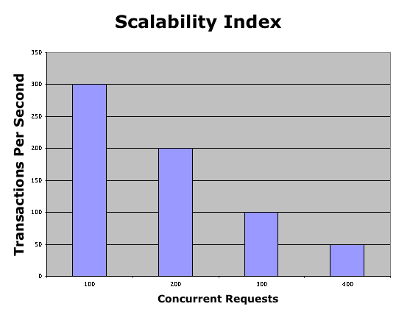
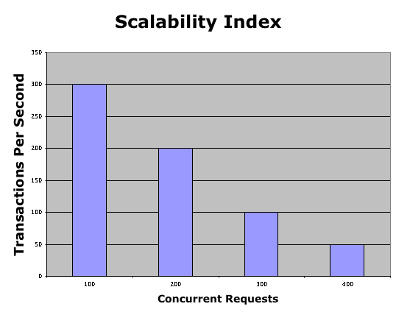
Figure 6: Bottleneck behavior
A Service Exhibiting a Scalability Problem
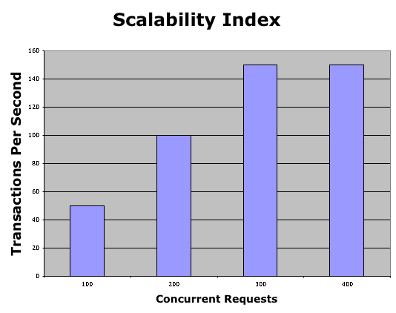
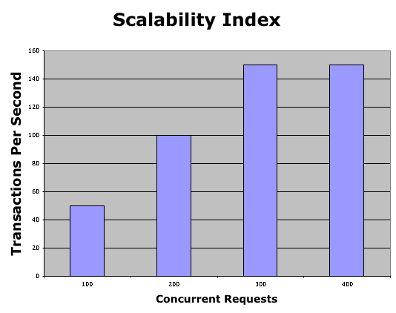
Figure 7: A Service Exhibiting a Scalability Problem
As shown in the first three columns, the system is capable of handling an increased level of concurrent requests. However, the fourth column shows the system hits an upper limit in handling transactions, typically resulting from a database indexing problem, a full data cache, or a saturated network connection.
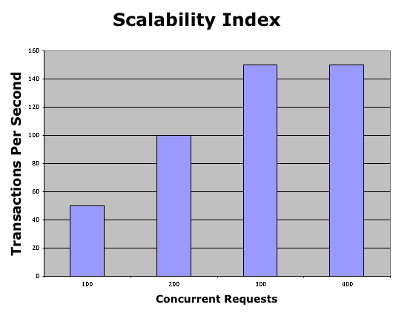
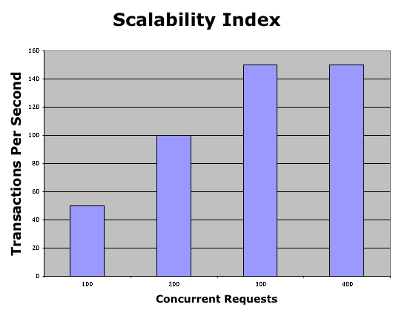
Figure 8: Scalability problem - upper limit reached
This simple TPS method can be convoluted, as shown by the results of the following scalability test.
Parameter Values Required to Calibrate a Test


Figure 9: Parameter Values Required to Calibrate a Test
From the results above, TPS increases only slightly even though the test is making 2.5 (25 / 10) times more concurrent requests. The TPS value should have increased by 2.5 times, to 0.775 (0.31 TPS at 10 concurrent requests × 2.5). Free-running threads generate concurrent requests with no sleep time between requests. Their job is to keep making requests to the server during the test period. Yet, the average response time with 25 users is 5.34 times longer (65,344 milliseconds at 25 users divided by 12,234 milliseconds at 10 users). Consequently, there are fewer opportunities to log results and therefore increase the TPS value.
Throughput (TPS) Decrease as Service Response Time Increases, as Measured from the Consumer
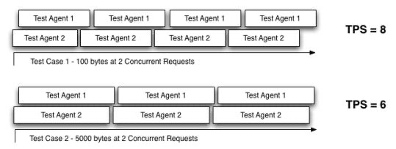
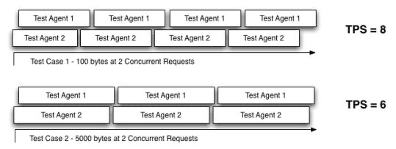
Figure 10: Throughput (TPS) decrease as service response time increases
When a test increases the number of concurrent users, one of three things can happen:
•
- The server takes less time (on average) to respond than at lower CRs levels. In this condition, each CR finishes sooner, logs a response (a transaction), and makes its next request much sooner. TPS increases from lower CRs levels.
•
•
How TPS Values Are Calculated in the Scalability Report
Assuming the reader has a fair knowledge of creating scenarios and viewing reports, this section explains how the TPS and Linear TPS values are calculated in the scalability report.
Below is the scalability report used for the TPS calculation:
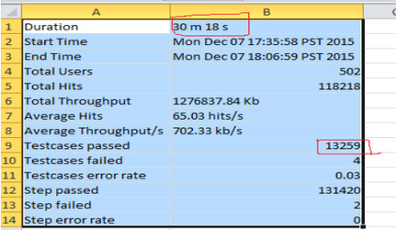
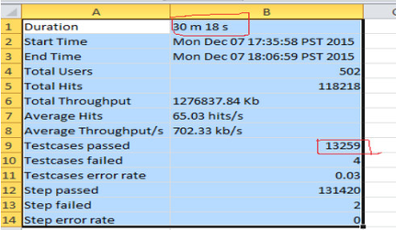
Figure 11: Scalability report for the TPS calculation
The formula for the calculation is:
TPS = Test Cases Passed / duration (in seconds)
From the iteration summary report, we get the test cases passed and the duration in seconds.
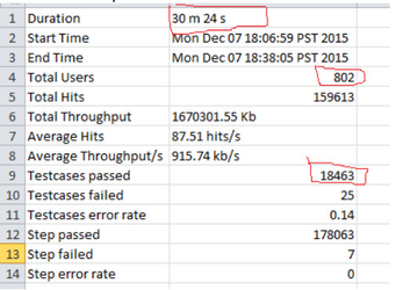
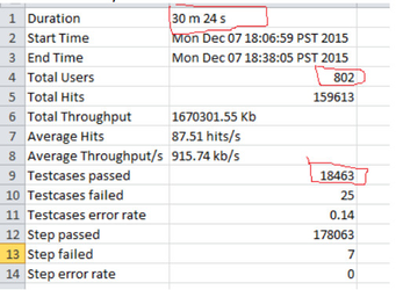
Figure 12: Iteration summary report
Using the iteration report above, 7.29 TPS is calculated. For the 502 (total users) iteration:
7.29 TPS = 13,259 / (30 × 60 + 18) s
Take iteration summary _801 and calculate 10.12 TPS.
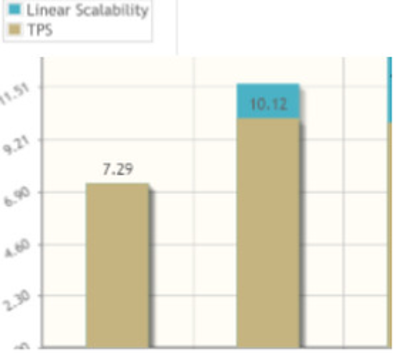
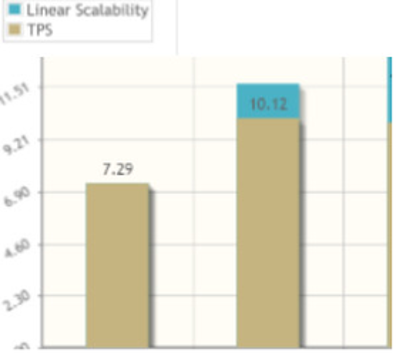
Figure 13: Iteration summary - 10.12 TPS
For the 802 (total users) iteration:
18,463 / (30 × 60 + 24) s = 10.12 TPS
To calculate the Linear TPS:TPS:
Linear TPS = (total users in the iteration summary which has linear scalability) × (TPS of the preceding iteration summary / total users in the preceding iteration summary)
11.65 TPS = 802 × (7.29 / 502)
Last updated: February 17, 2023
If you have any feedback on this topic, please contact us
If you have any feedback on this topic, please contact us at documentation@appvance.ai