
Configure AppDynamics Integration for AIQ Monitoring
Configure AppDynamics Integration for AIQ Monitoring
BeforeLast youreviewed: canSeptember even21, start2026
Use this page when AIQ performance testing needs to configurecorrelate execution data with AppDynamics monitoring. Configure only the minimum access required for the target environment.
When to use this guidance
- AppDynamics is used to monitor the application under test.
- AIQ results need to be correlated with APM metrics.
- Operations teams have approved access to the monitoring tenant.
Recommended approach
- Confirm the AppDynamics
monitorcontrollerinURL,AIQ,application,you need to make sure that your AppDynamics collector agent is running in the desired server where your target monitor resources are located, make sure that your collector agent is uptier, andrunning,metricandscope. - Create
thatorit is actually reporting data to AppDynamics Controller, if you cannot see any data at your Controller then you won’t get any metrics from AIQ either.Here’suse anexampleapprovedofread-onlyhowintegrationshould look like a Controller retrieving data from its respective agent collector: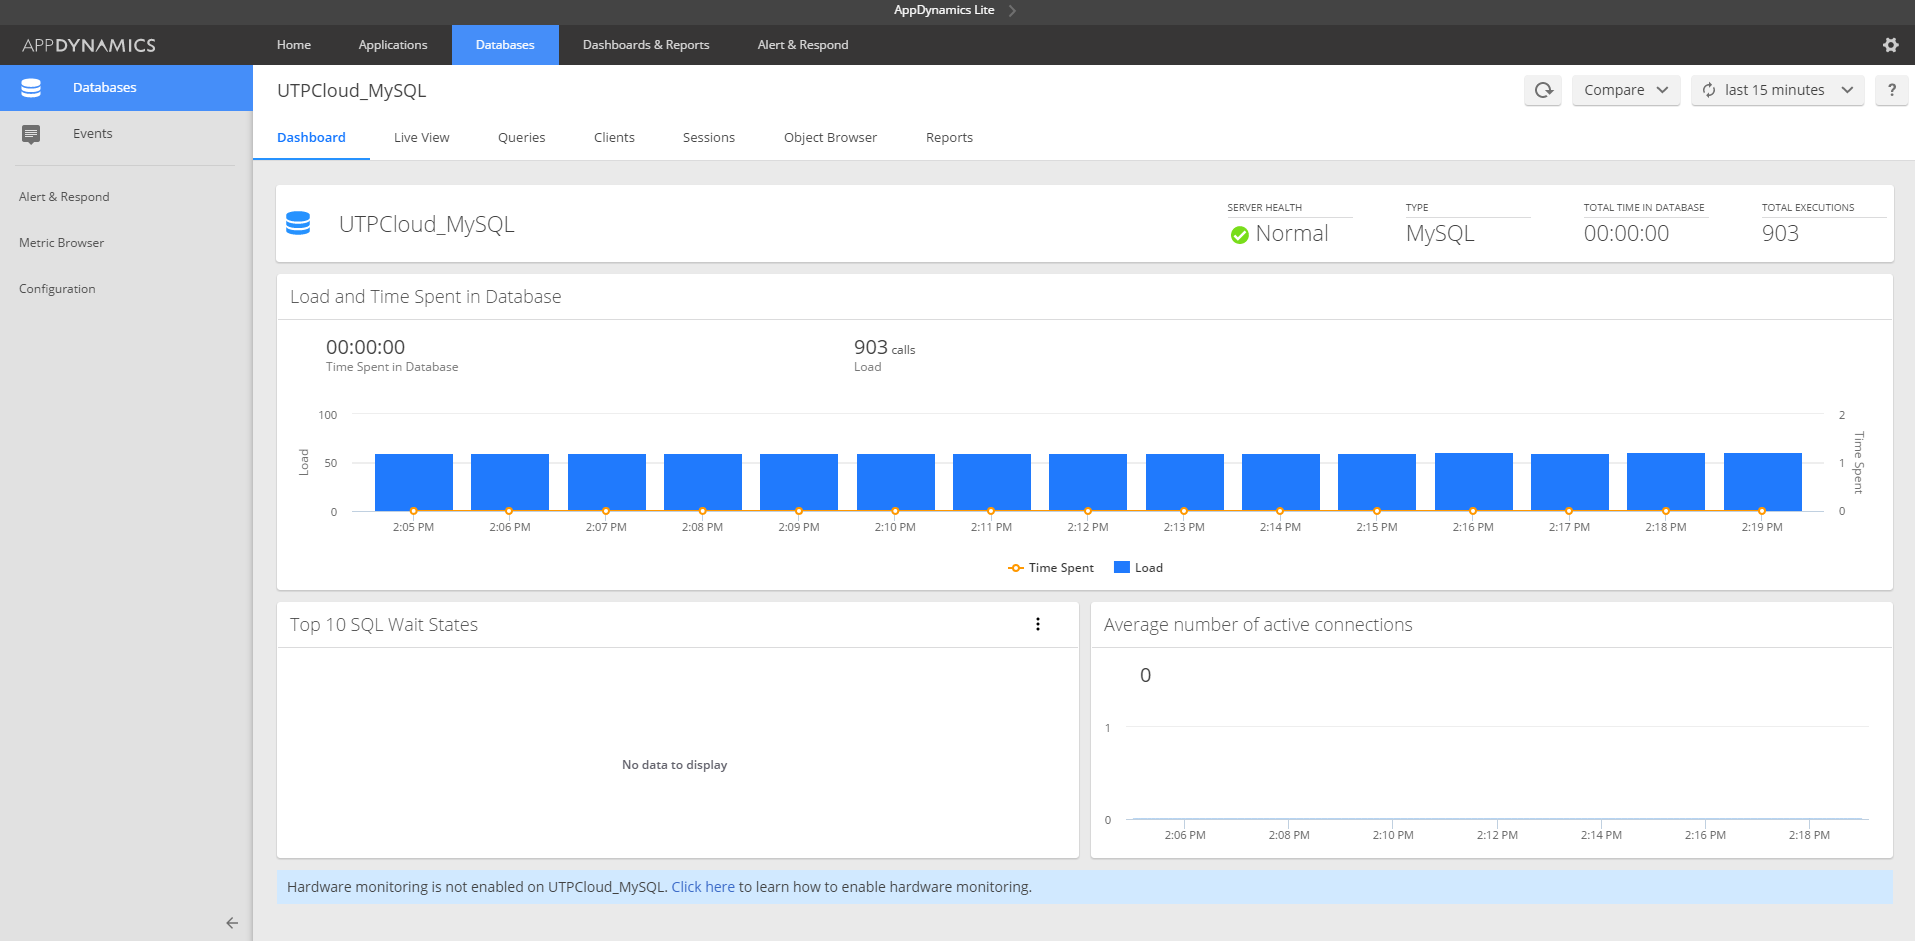
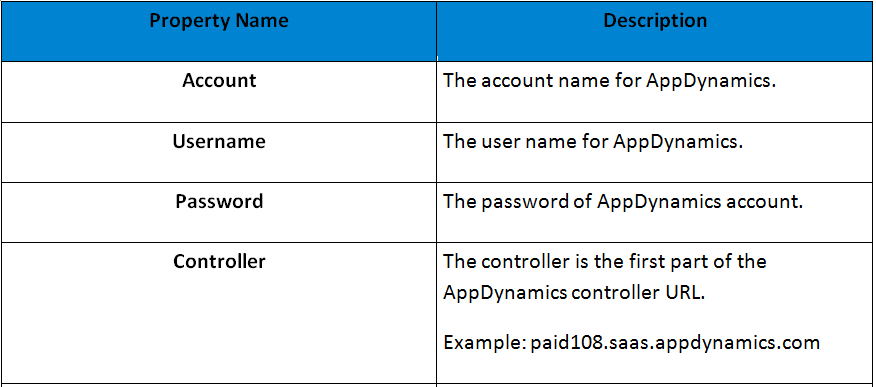
Once you’ve made sure that your AppDynamics Controller is reflecting data, you can proceed to add the AppDynamics monitor into AIQ. Now, the first things you need to have handy are your AppDynamics log-in credentials and your controller URL. It’s important to know that your AppDynamics Controller must be available through a public access server, meaning that the server where your controller is located must be visible through the web so AIQ can be able to access itaccount orin the same machine as AIQ is. (If you’re using a Controller web page provided by AppDynamics then is already accessible and ready to listen for AIQ requests).AIQ will require the following settings to connect with AppDynamics: Account name
User name
Password
Controller
Clickor theintegration “Monitorsetting Config”for tab.
Bya default,short there will be 2 configurations available.
PC
TestNode Java
Selecting any of the above will display all the configuration details like the configuration name, Time Delaystest and Property Names.
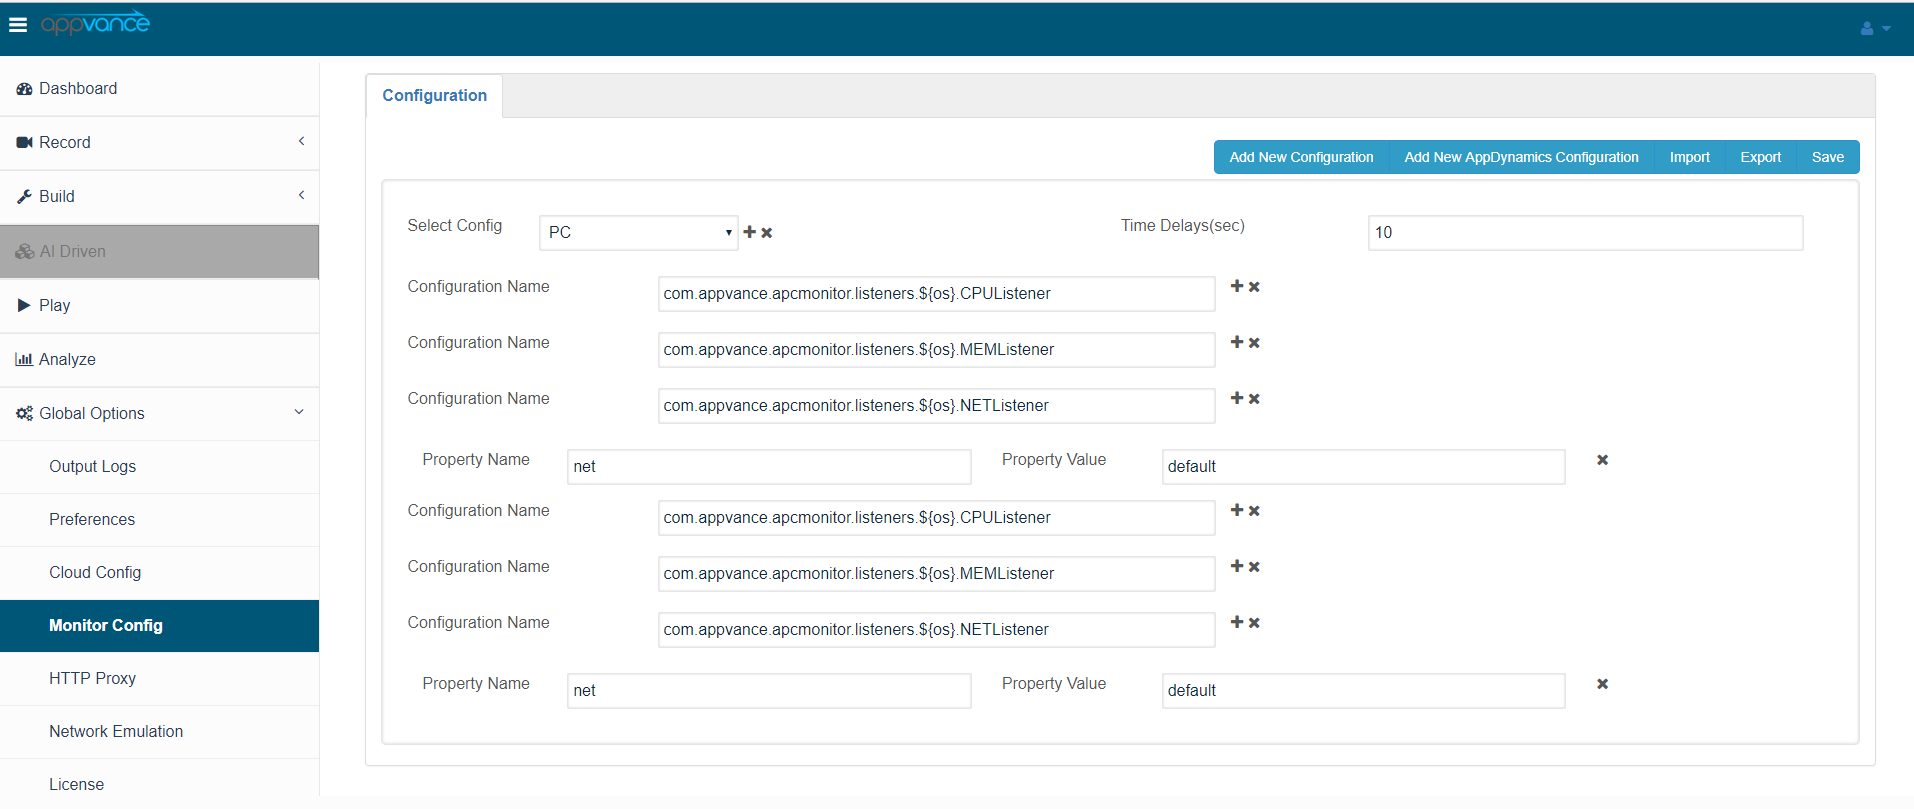
Users can add as many Configuration Names as required and are available, users should be aware of different listeners to add all the new configurations.
At the same time, users can remove the configuration names by using the X symbol available next to each of those.
TestNode Java Configuration
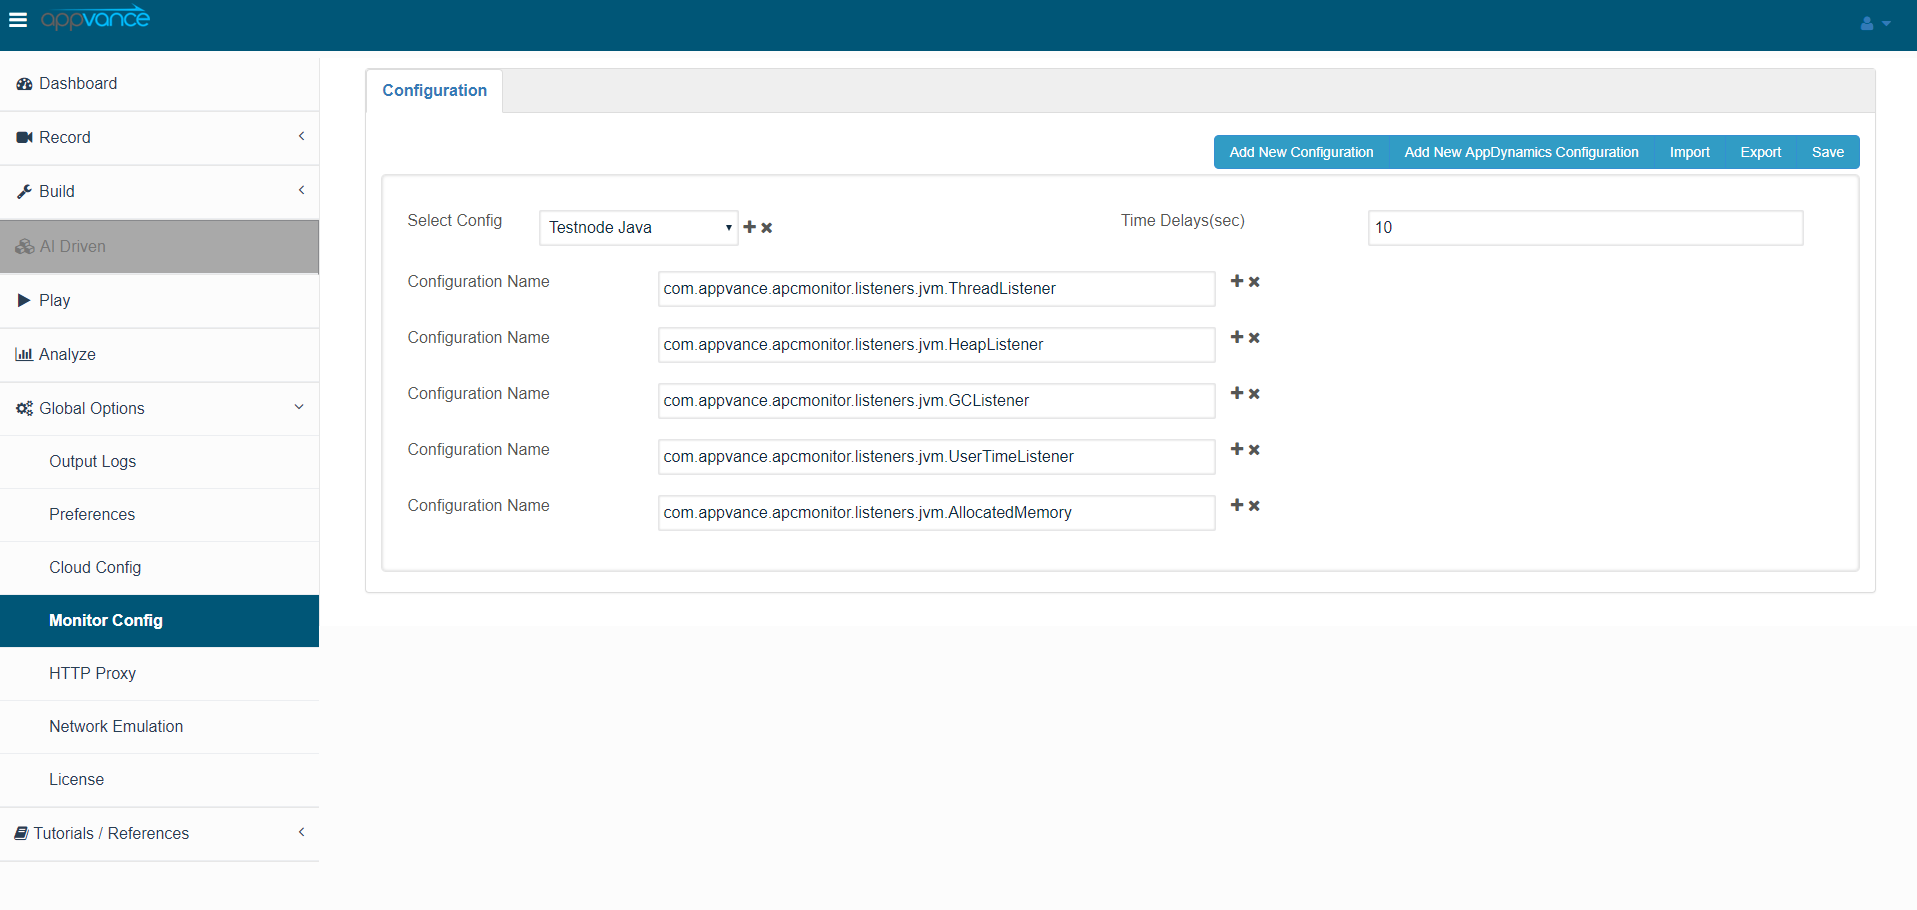
All these will be displayed in the monitor report from the report page. (Will be discussed later)
Adding AppDynamics Configuration:
Click the + symbol available next to the list of available configurations, this will be used to create a new configuration
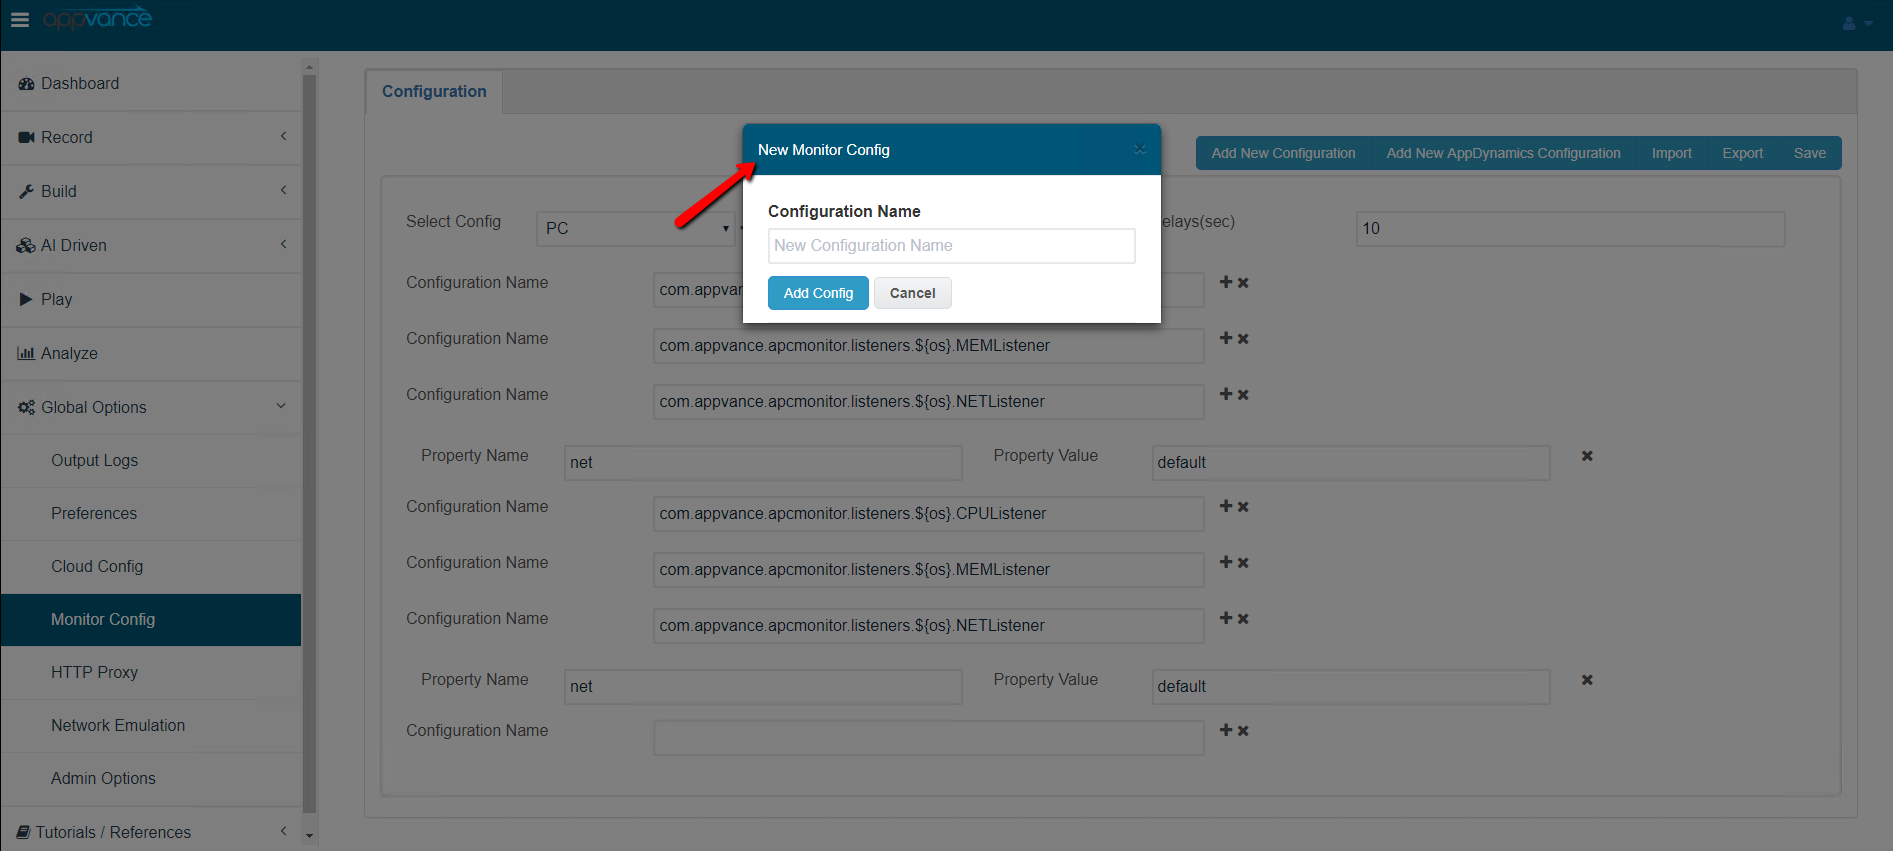
Provide a valid name for the Configuration Name: Example “AppDynamics” and click Add config button
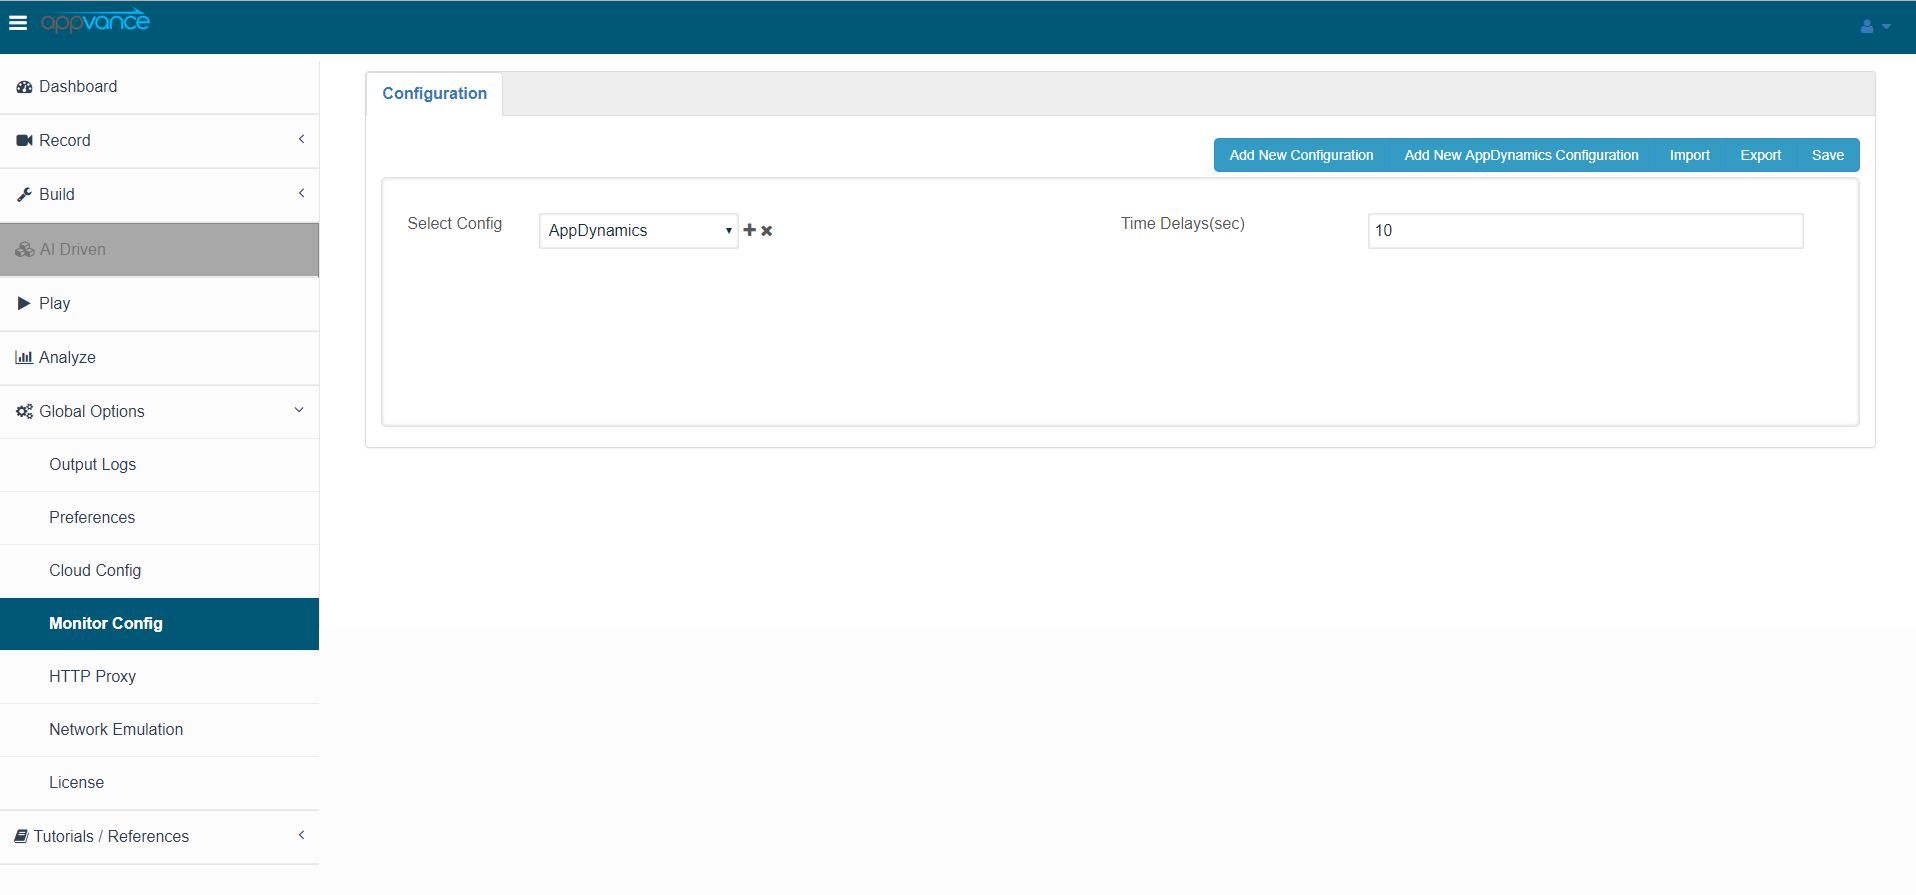
Click the “Add New AppDynamics Configuration” button which will open a new wizard as shown in the below screenshot
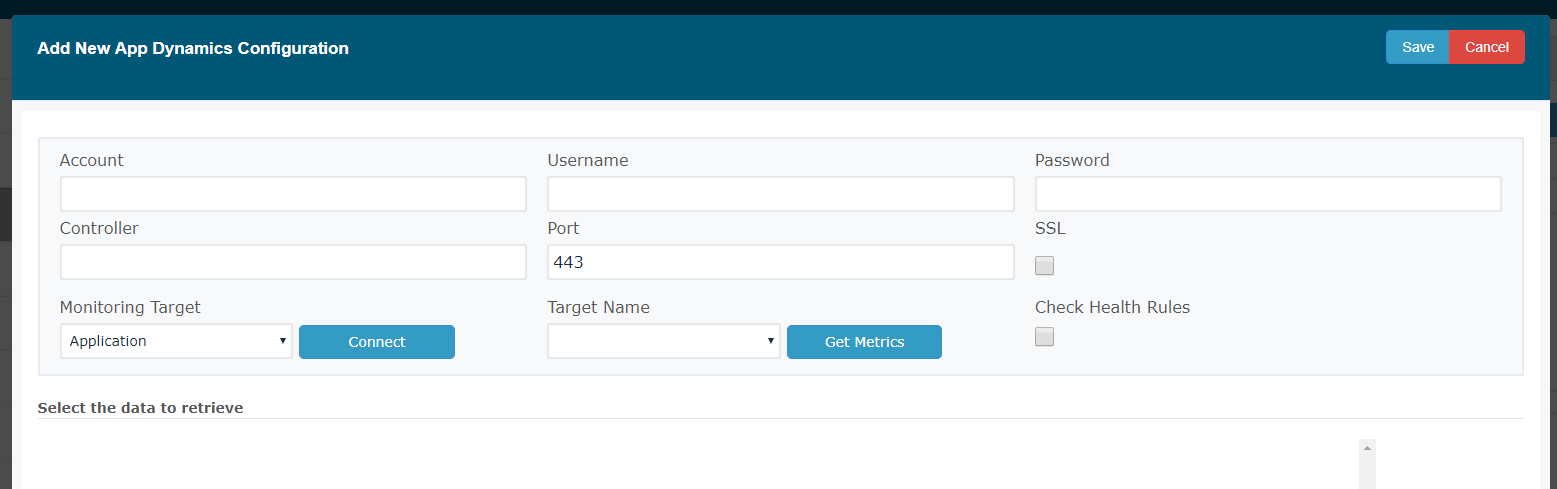
Add all the required configuration properties for AppDynamics
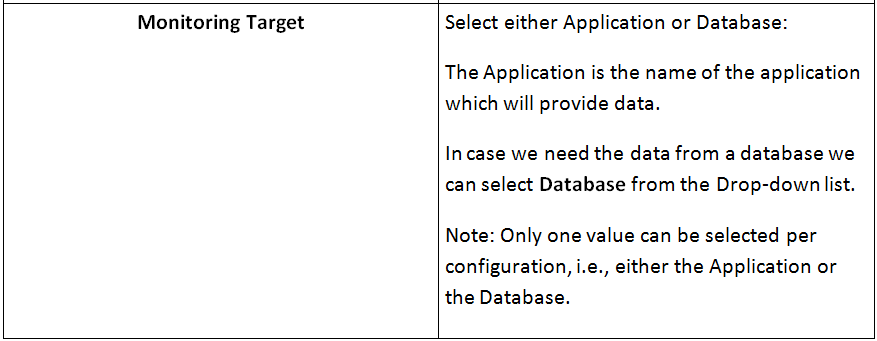
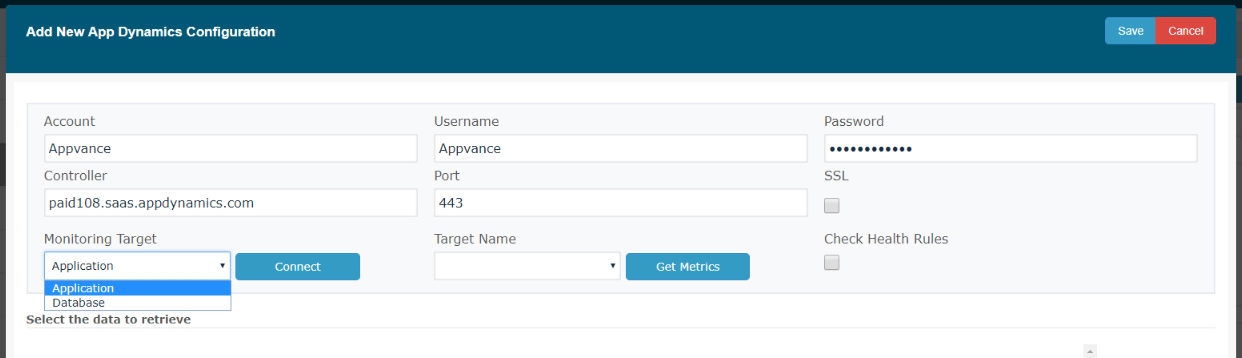
Providing all these required values and clicking on Connect will pull all the Applications or the Databases based on the selection
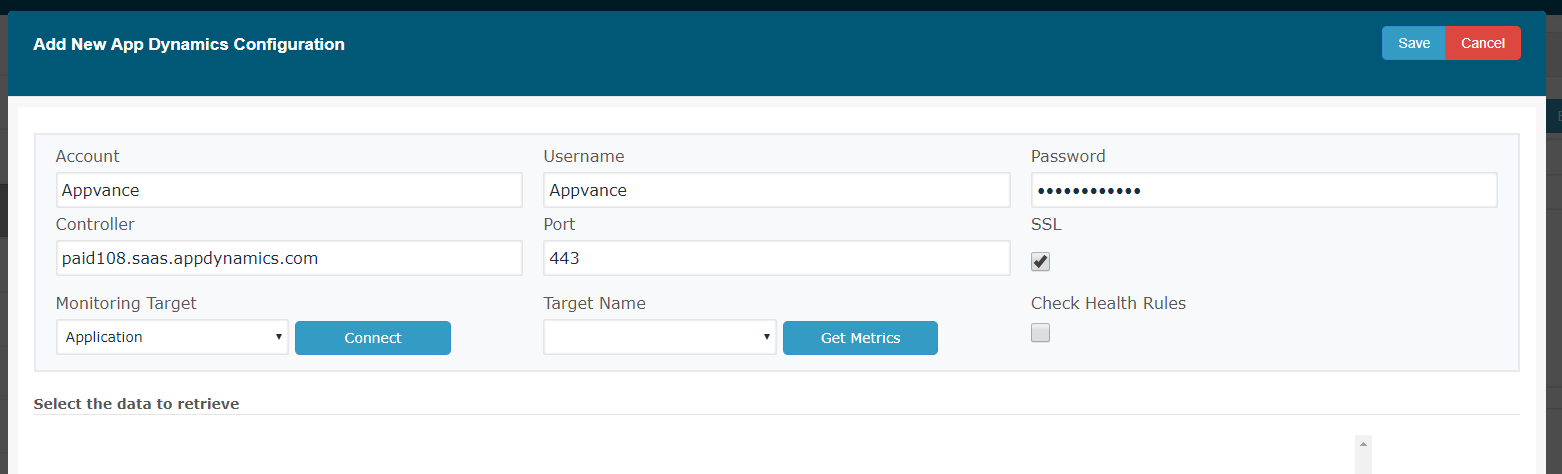
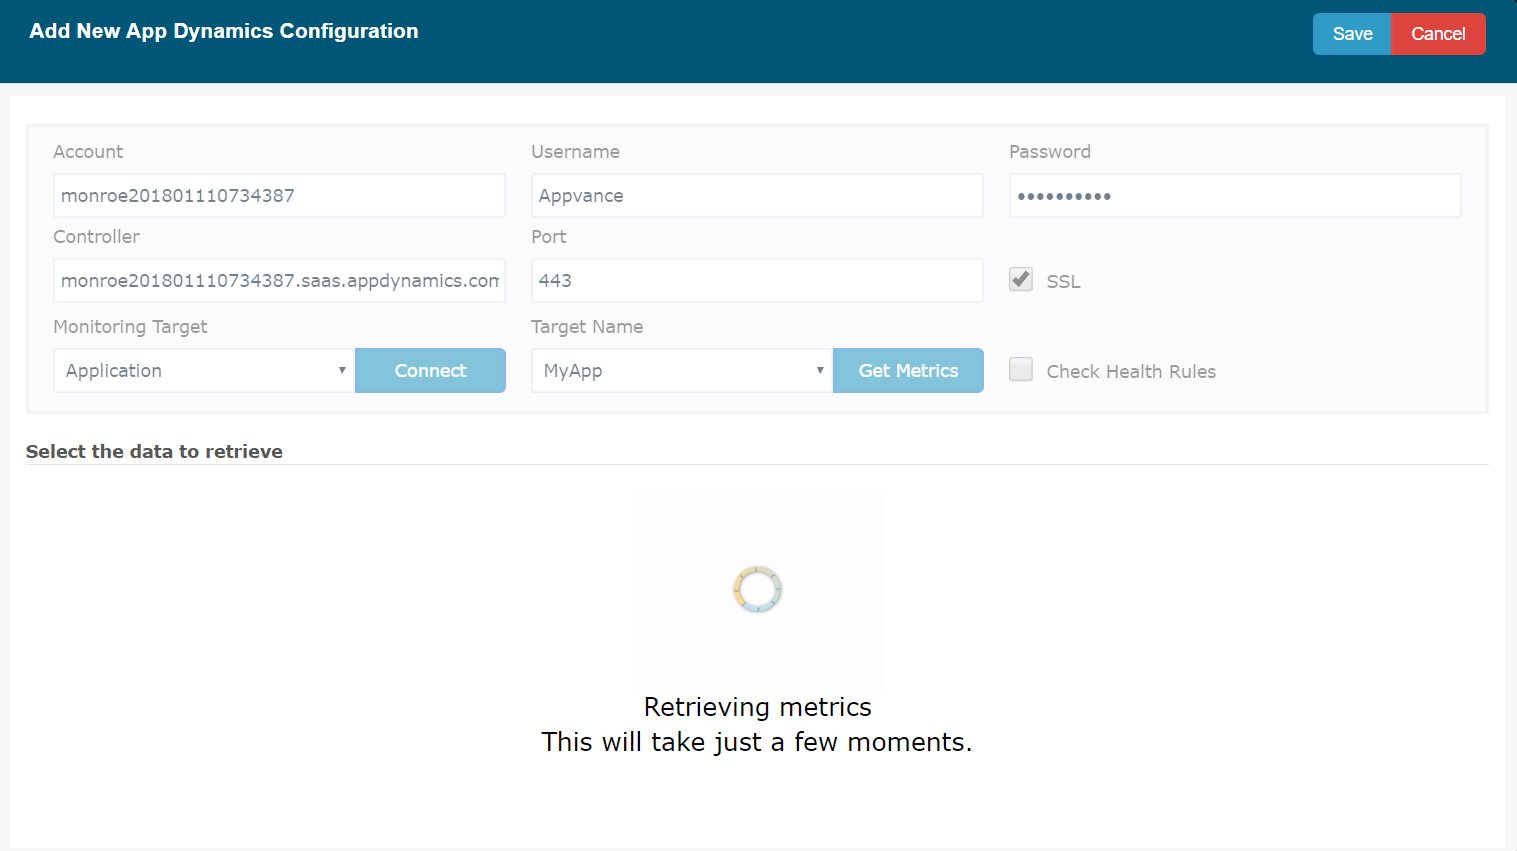
Clicking on Get Metrics will get all the properties related toverify that application and the user can select the data from the list to retrieve which in turn will be seen in Monitor reports
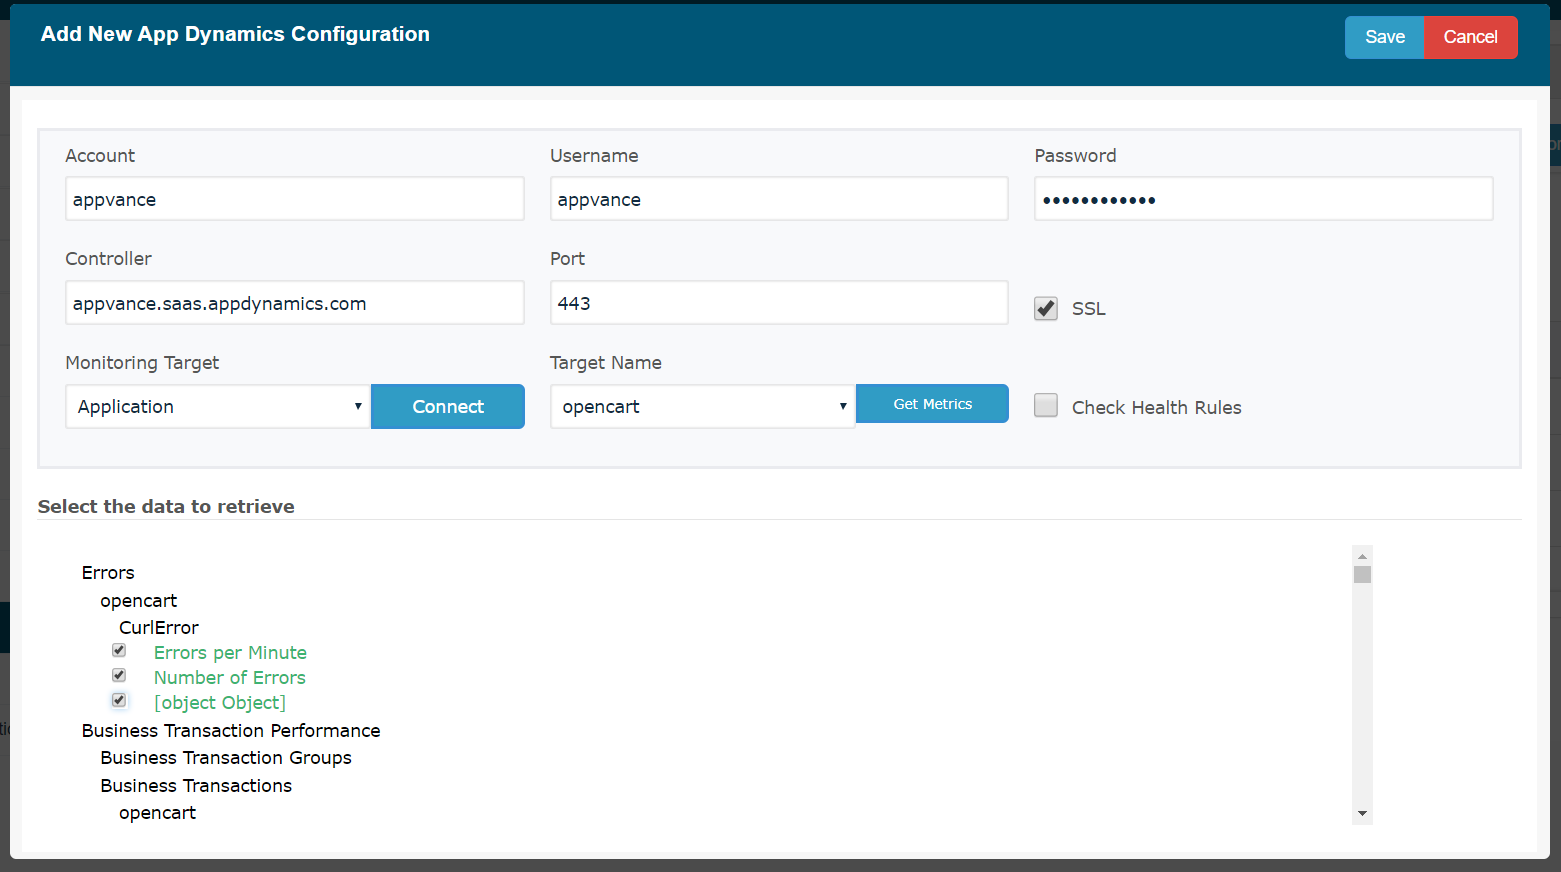
Users can select the required Data from the populated list and Click Save. The metrics tree shall only have check-boxes for actual metrics (leaves), not folders. As seen in the below screen-shot, all the selected metrics will be populatedalign with the propertyAIQ nameexecution window.
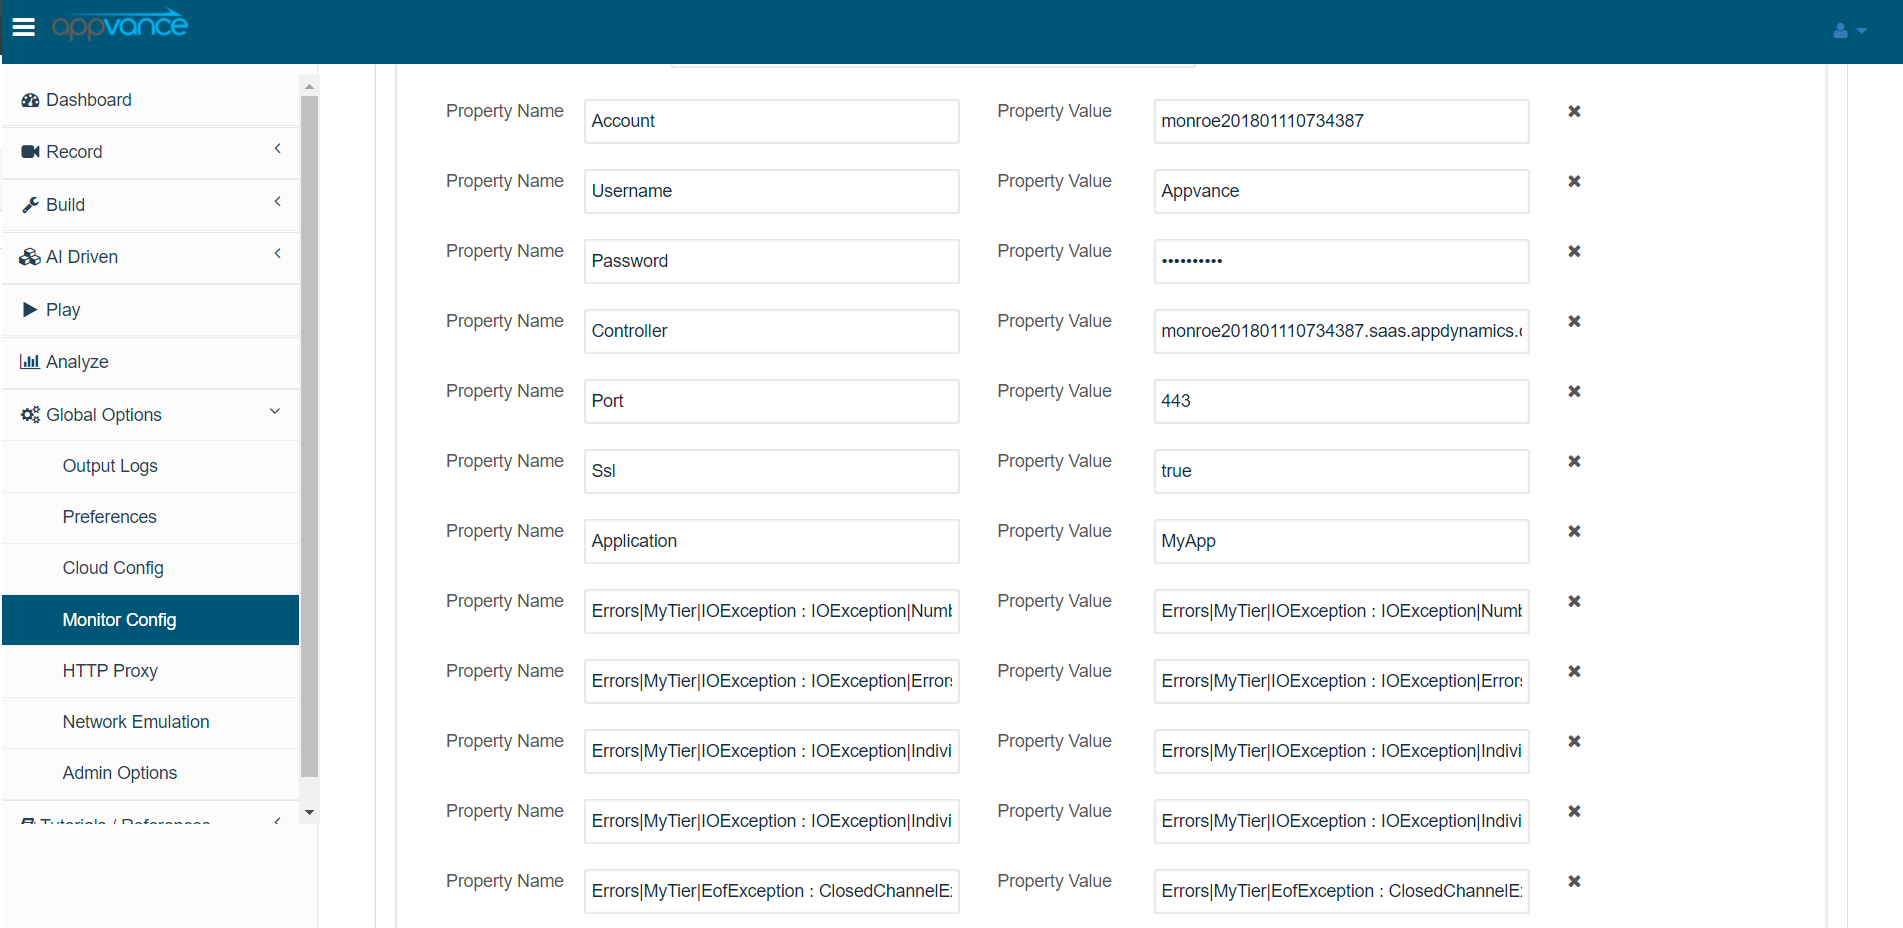
ClickNote: SaveDo tonot savestore theAPM AppDynamics configuration.
Users can also Export the saved configuration by clicking on the Export button, Configuration will be exported and saved to your local machine which can be used later by using the Import function to import back the saved config settings.


Running Scenario from IQ
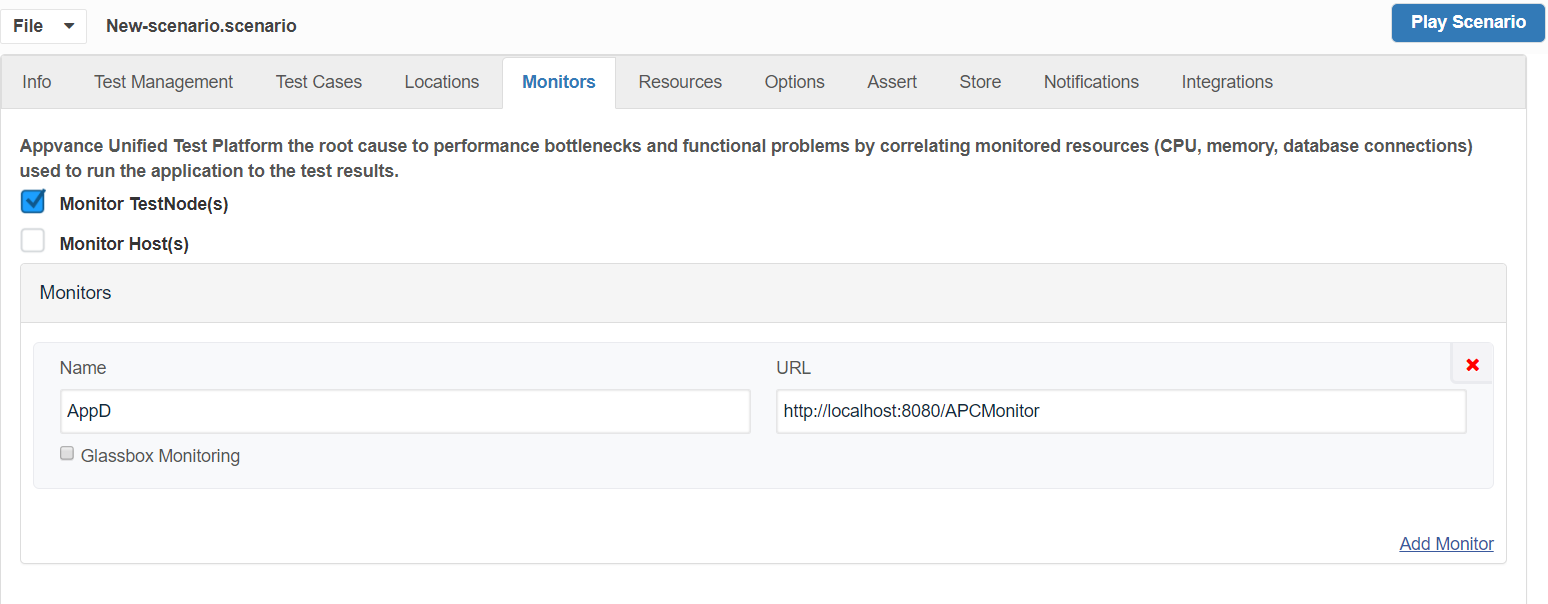
To monitor a remote machine user should add "/APCMonitor" at the end of the URLcredentials in thescreenshots scenario builder. Below is the screenshot
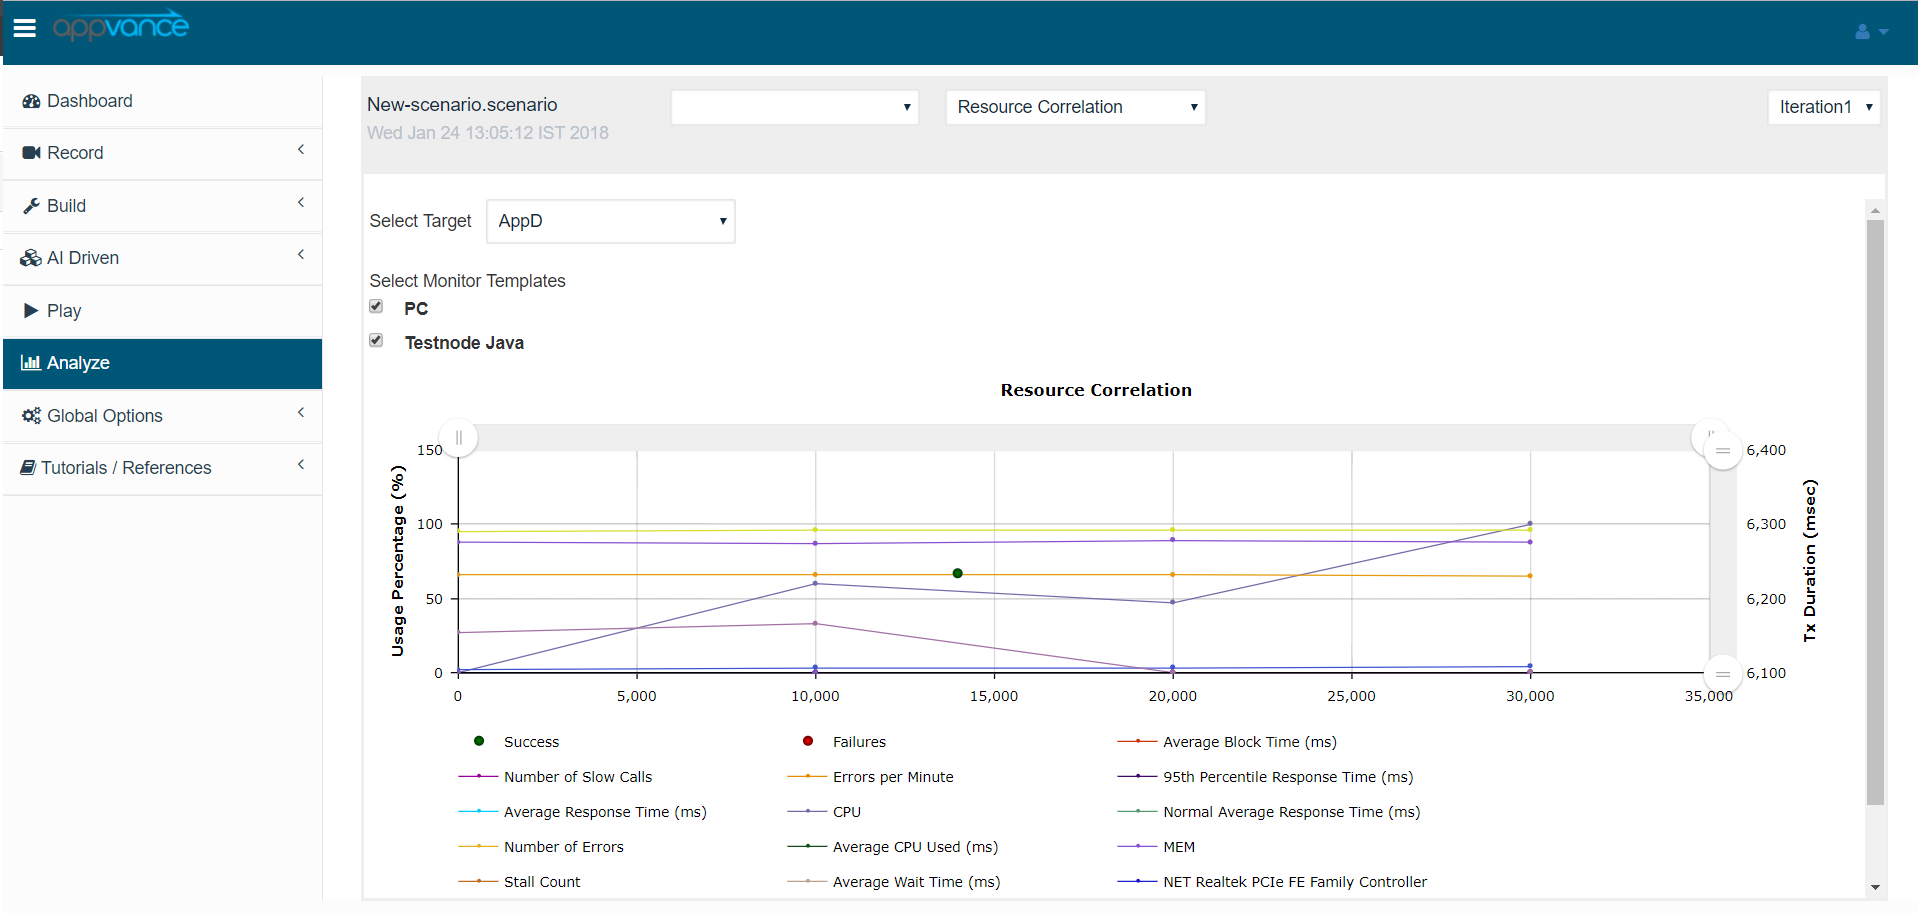
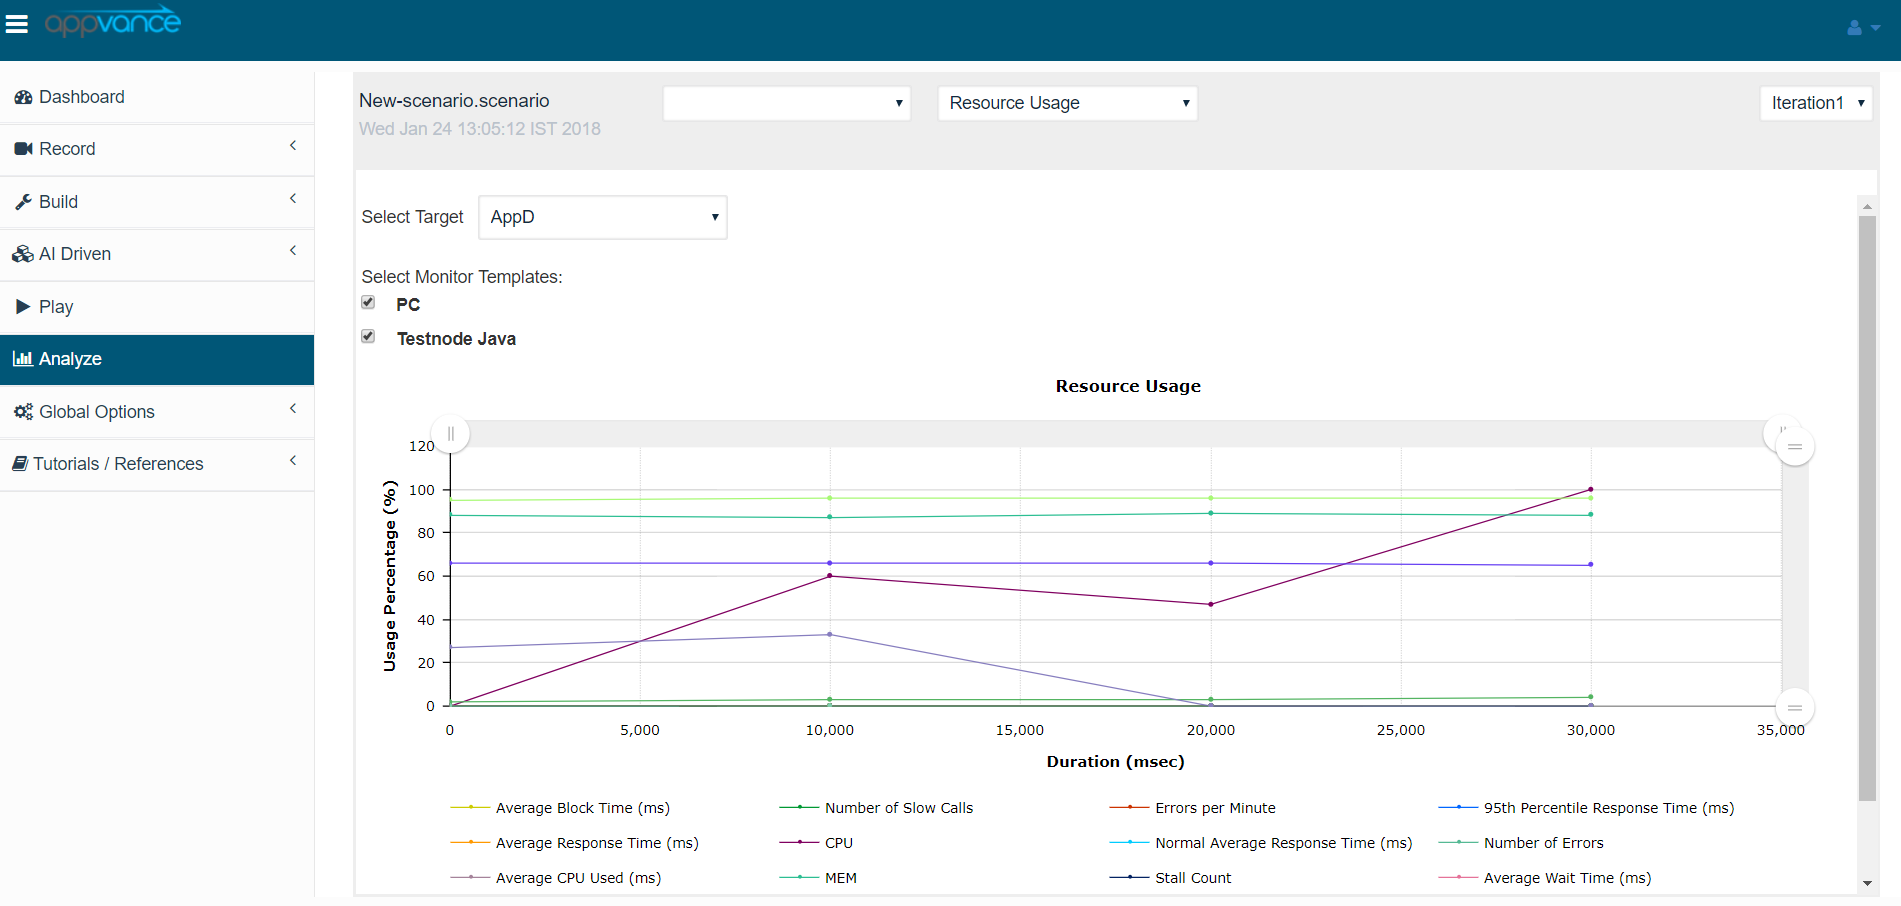
Running a Scenario after the configurations were added and saved successfully and navigating to the Reportsor page notes.
Click Resource Usage, and all the configurations saved will be displayed here with the check-box, user can select different configurations based on the requirements
Last updated: JulySeptember 03,21, 20232026
If you have any feedback on this topic, please contact us at documentation@appvance.ai.