
Evaluate Linear Scalability
Evaluate Linear Scalability
Linear scalability describescompares app performance wherehow the appapplication takesresponds theas sameload amountincreases. ofA scalable system should increase throughput predictably while keeping response times and errors within acceptable limits.
What to compare
- Virtual users or request volume at each load level.
- Throughput and transaction completion rate.
- Response time
totrends,operateincludingapercentiletestbehavior. - Error
use case regardless of the number of concurrent users. For example, an app scales linearly when it takes 20 seconds to operate a use case with 100 concurrent usersrate and1000applicationconcurrentorusers.infrastructureUnifiedsaturationTestsignals.
Recommended operatesworkflow
- Run controlled tests at
multipleincreasingvirtual userload levels. - Keep
UnifiedtestTestdata,Platformenvironment,automaticallyandcalculatesscenariolinearmixscalabilityconsistentinbetweenaruns. - Compare
Scalabilitysteady-stateIndexperiodsreport.instead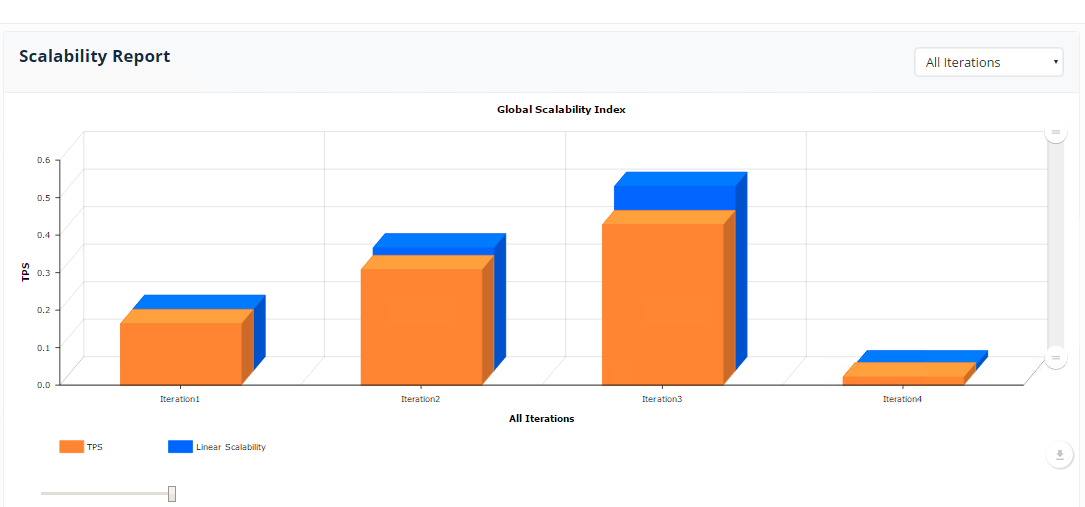
Inramp-up or unstable intervals. - Identify the
above example, Unified Test Platform runs a performance test at four levels of load: 4 Iterations are run by varying the user load. Unified Test Platform operates the use case by running 4 iterations. The Scalability Index shows a number of use cases (transactions) divided by the test time.An app demonstrating linear scalability is able to handle the additionalloadwithoutleveltakingwherelongerthroughputtostopsprocess transactions.Once you see a scalability bottleneck, as the above example, use the Resource Monitoring chart to see if the servers running the app have run out of resources. Other reasons for a performance bottleneck include: The app does not cache values and is performance constrained by slow database queries.
The app uses static values that are shared between users
The app enters a race condition among the users
The app depends on oneincreasing or moreerrors information services and the services are running slowly at load
Unified Test Platform counts only successful transactions in the Scalability Index results. Some failures take longer than others. For example, app log-in failures because the app failed may happen in the first few seconds of a long use case. A view of the Transaction Distribution report will uncover a performance bottleneck's root cause from failed transactions. Additionally, the Controller window displays a Total Transaction chart to show transaction activity for successful and failed transactions.
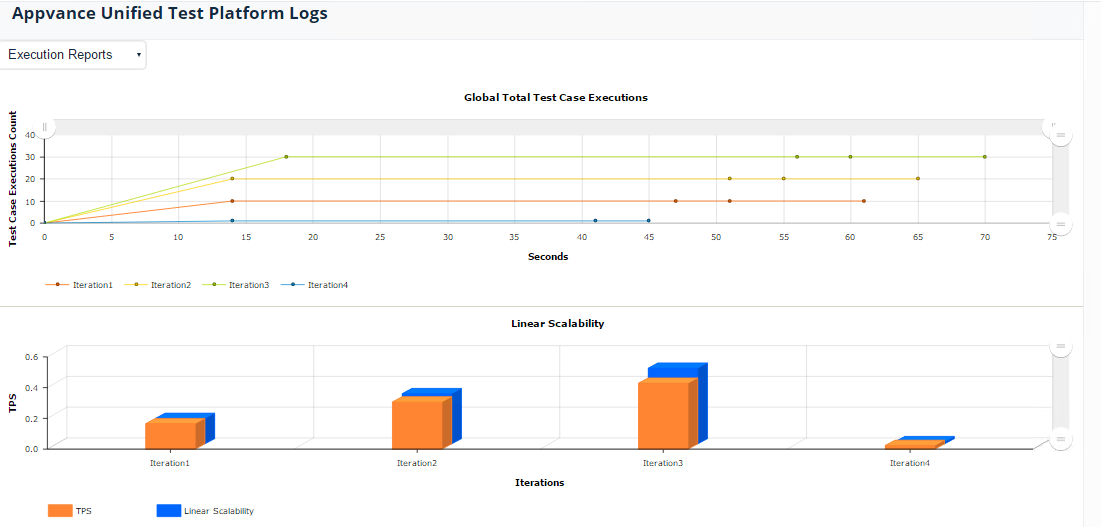
Apps with linear scalability have equal transaction times for the duration of the test time. Some apps' performance will slow during a test. The desired performance is a flat line in the Total Transactions chart. If the app slows its performance during the duration of the test time the Total Transaction chart will show a curved line to the right. Some apps using caching mechanisms will show increased performance during the duration of the test time, indicated by a curved line to the left.
Last updated: JuneSeptember 26,18, 20232026
If you have any feedback on this topic, please contact us at documentation@appvance.ai