
AppDynamics Integration
As mentioned earlier it is very easy and simple to Integrate AppDynamics in Appvance IQ.
After logging in successfully go to Global Options.
Under Preferences > Click LastAPM reviewed:Integration
24,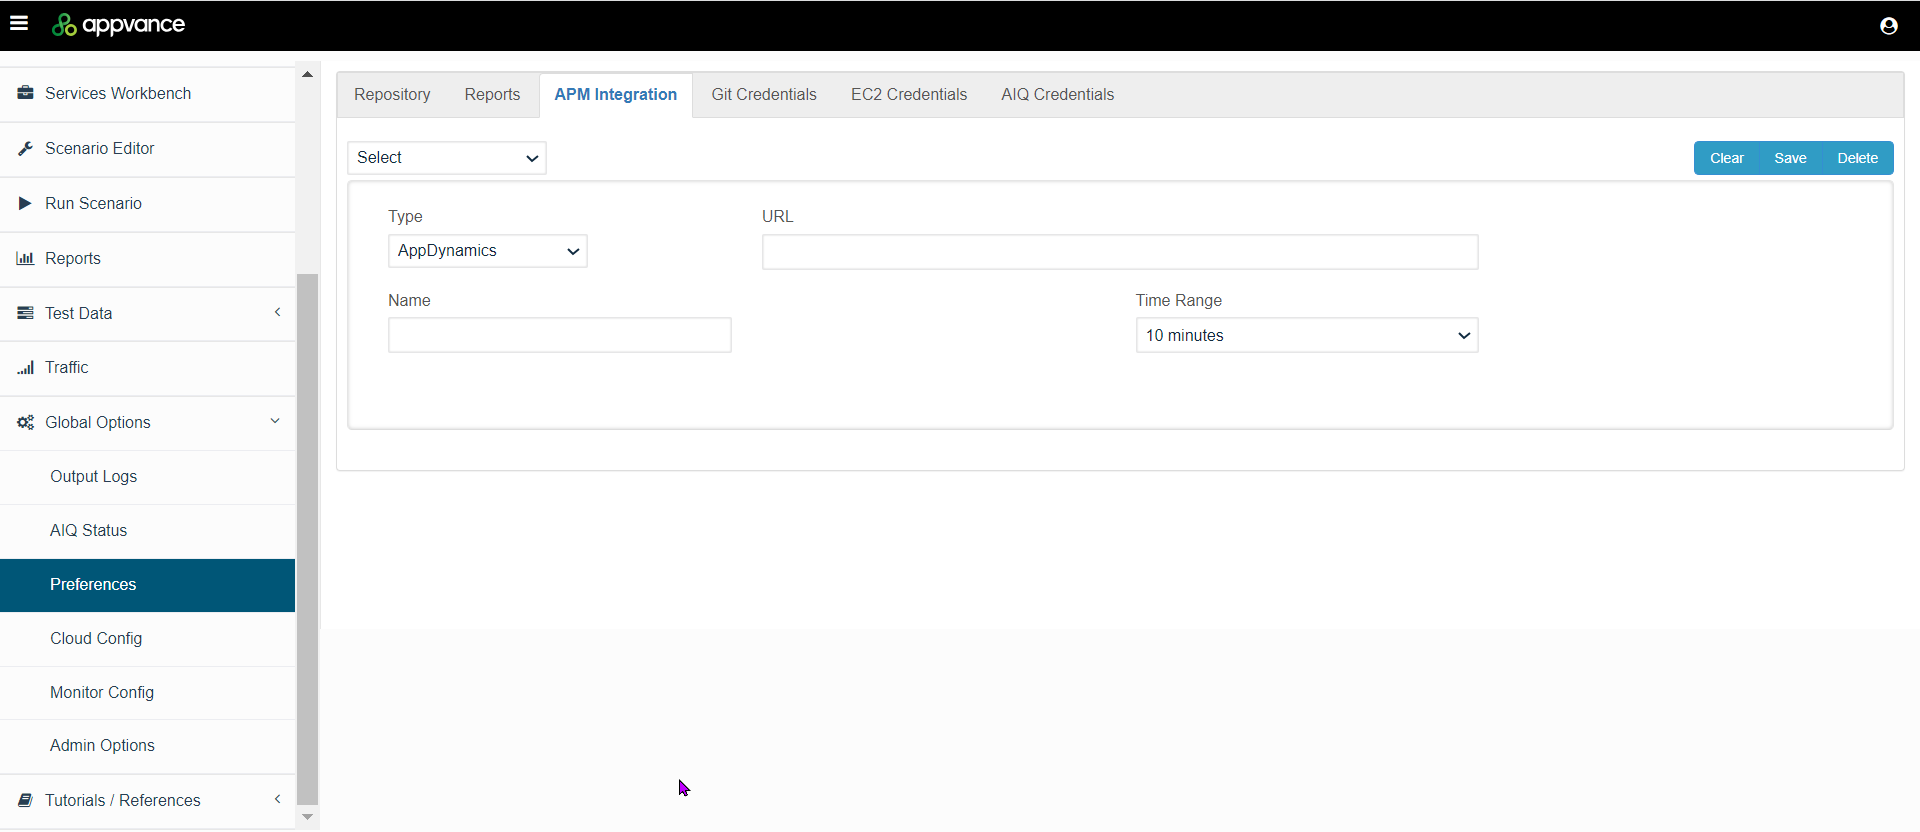
2026
Configure the following options:
Type: Select AppDynamics from the dropdown.
URL : is to simply provide the dashboard URL from AppDynamics integrationof what you are looking for (Discussed below).
Name : is a text field that you can use to provide meaningful names for your Reports, say if you are monitoring Memory or CPU or something particular, you can name those with a corresponding URL from AppDynamics.
Time Range : Has values of 10, 30, and 60 minutes.
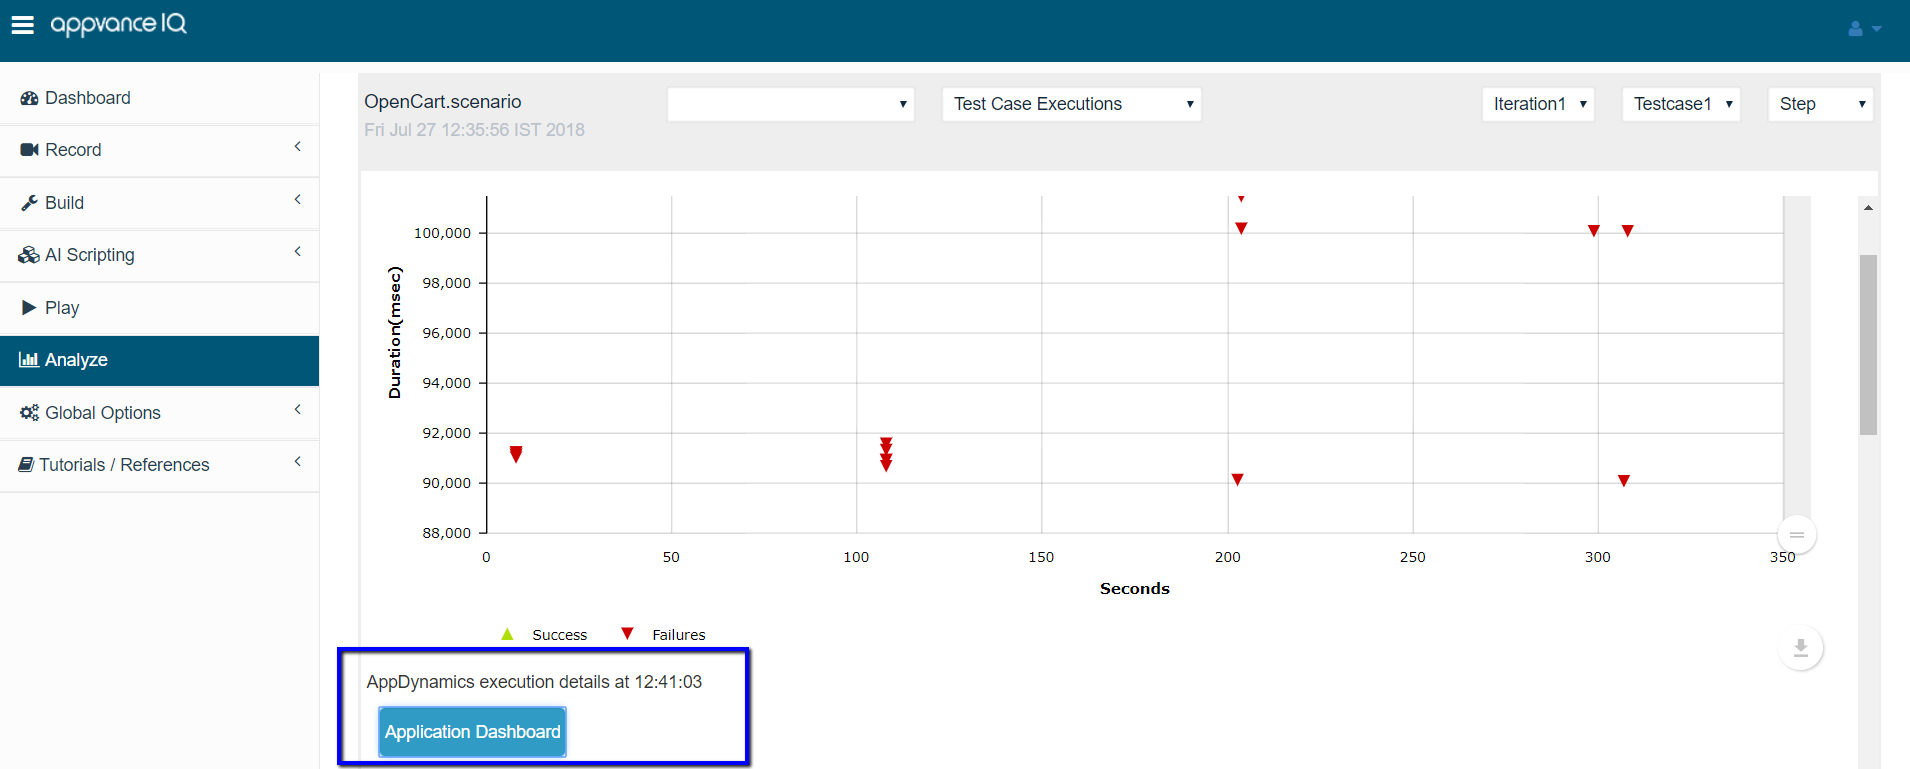
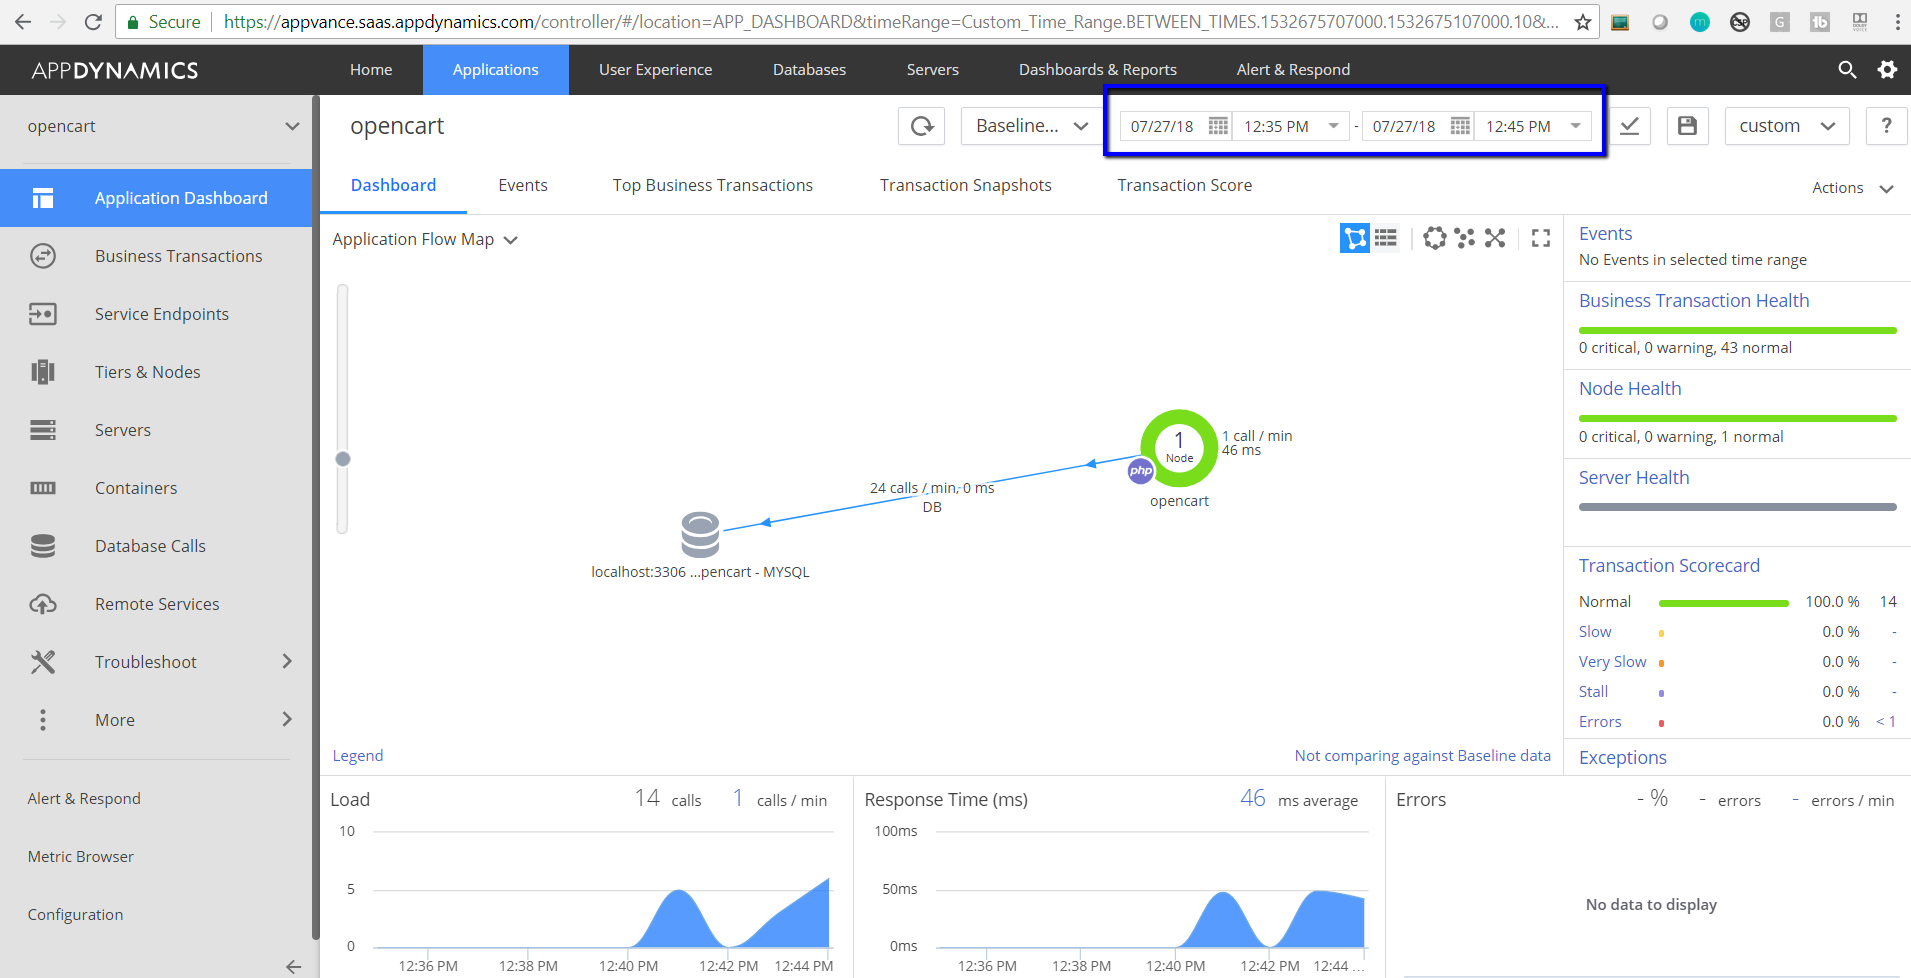
When a transaction is chosen at a given point in time (The time Range chosen is 10 mins), for example the below transaction happened at 12.41, and clicking the AppDynamics link will take you to that particular dashboard page or report page and the time range on the dashboard would be -5 minutes and + 5 minutes (i.e., 12.35 to 12.45)
INTRO
INTRO
and buttons to Clear, Save and Delete.
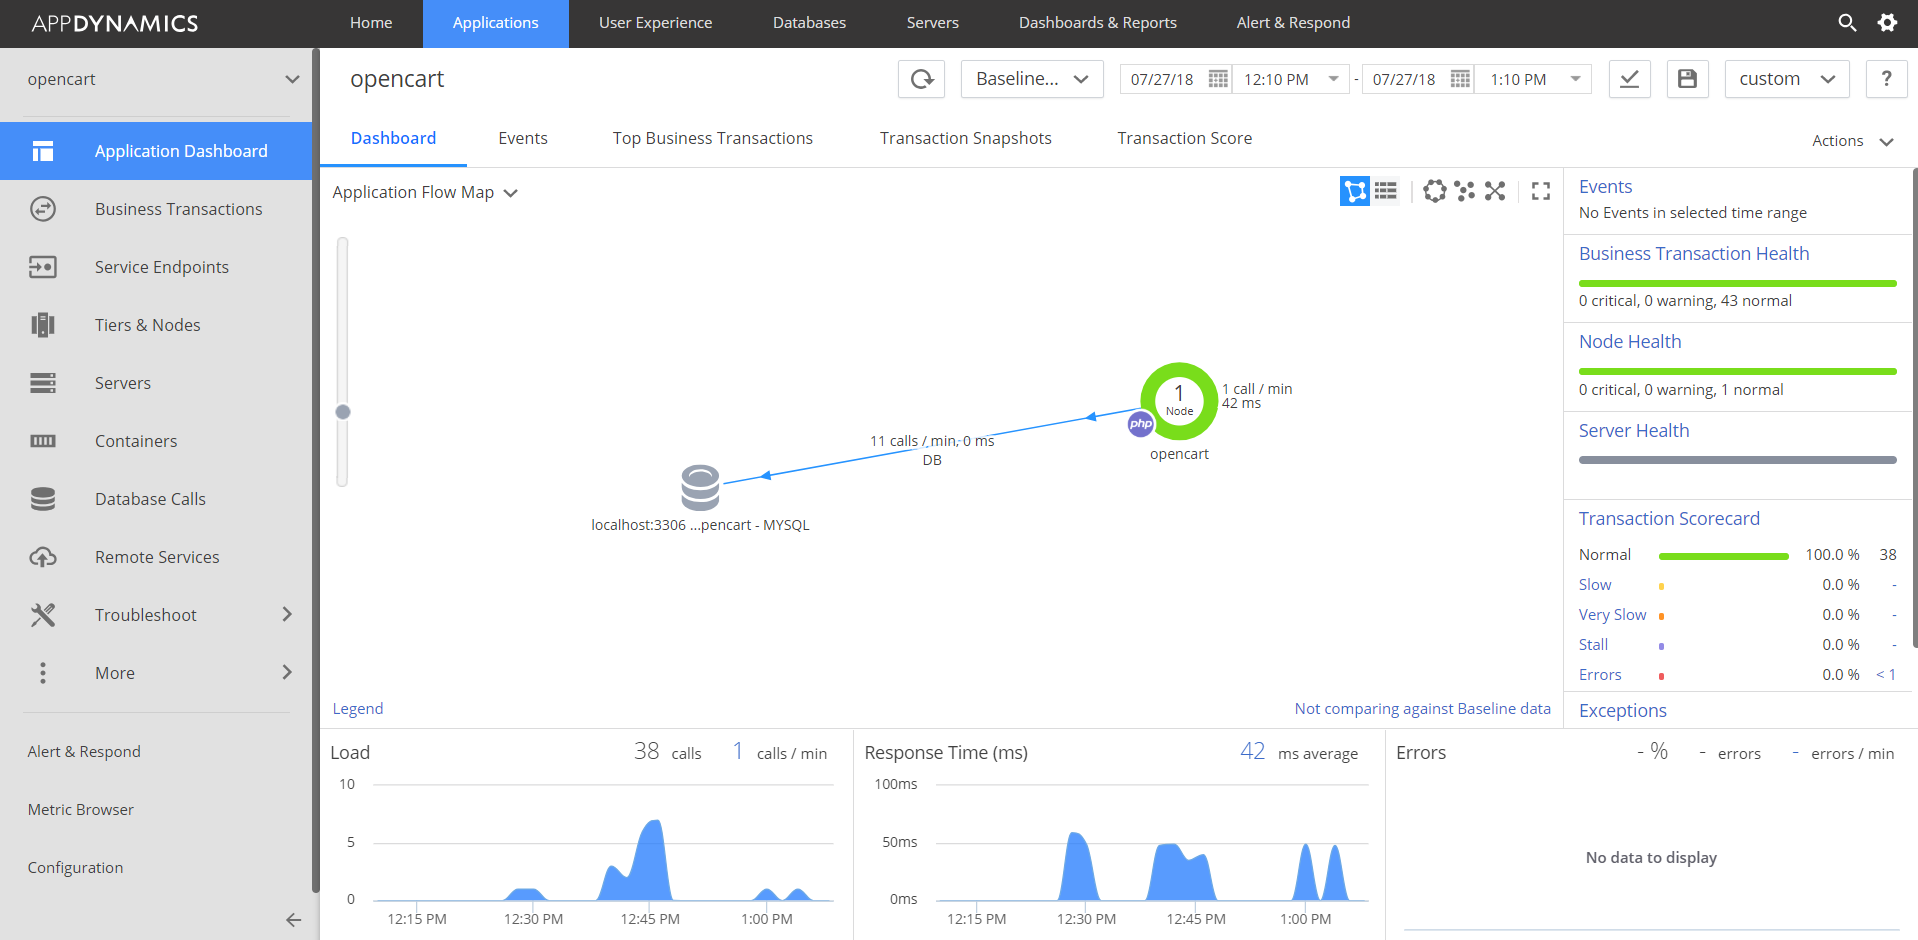
Log in to your AppDynamics Account and choose an Application or a Server or a DB (that is already configured) based on what needs to be monitored
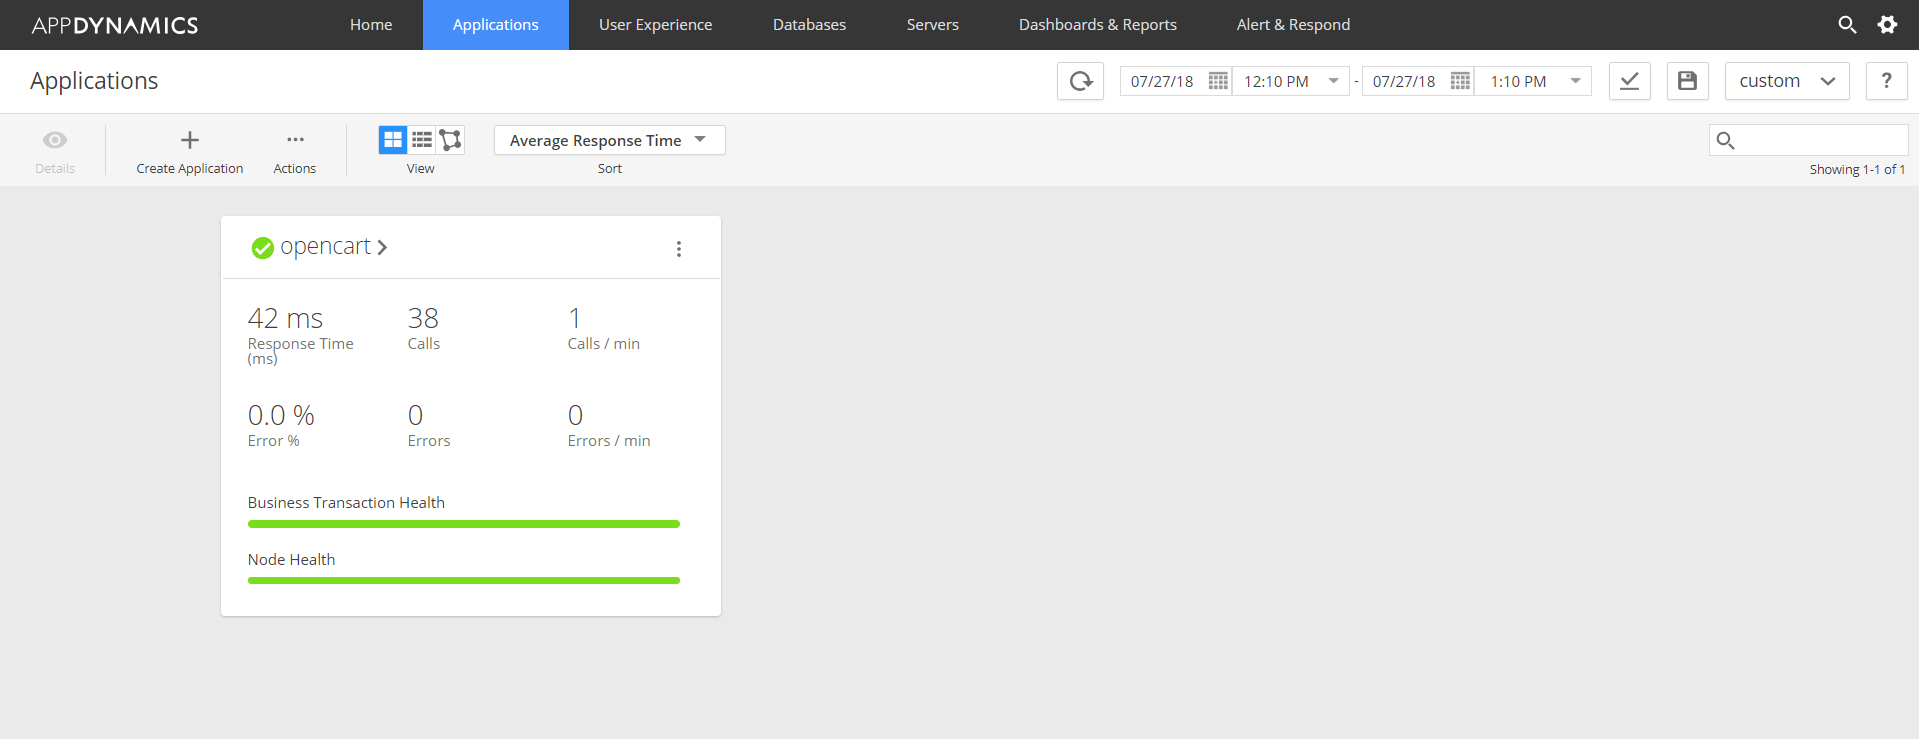
As seen in the below screenshot, Application Dashboard has been chosen, you can simply copy the URL from the address bar and paste it into the URL section of AppDynamics Integration and provide a meaningful name say 'Application Dashboard' and click Save
Below is the configuration made in Appvance IQ
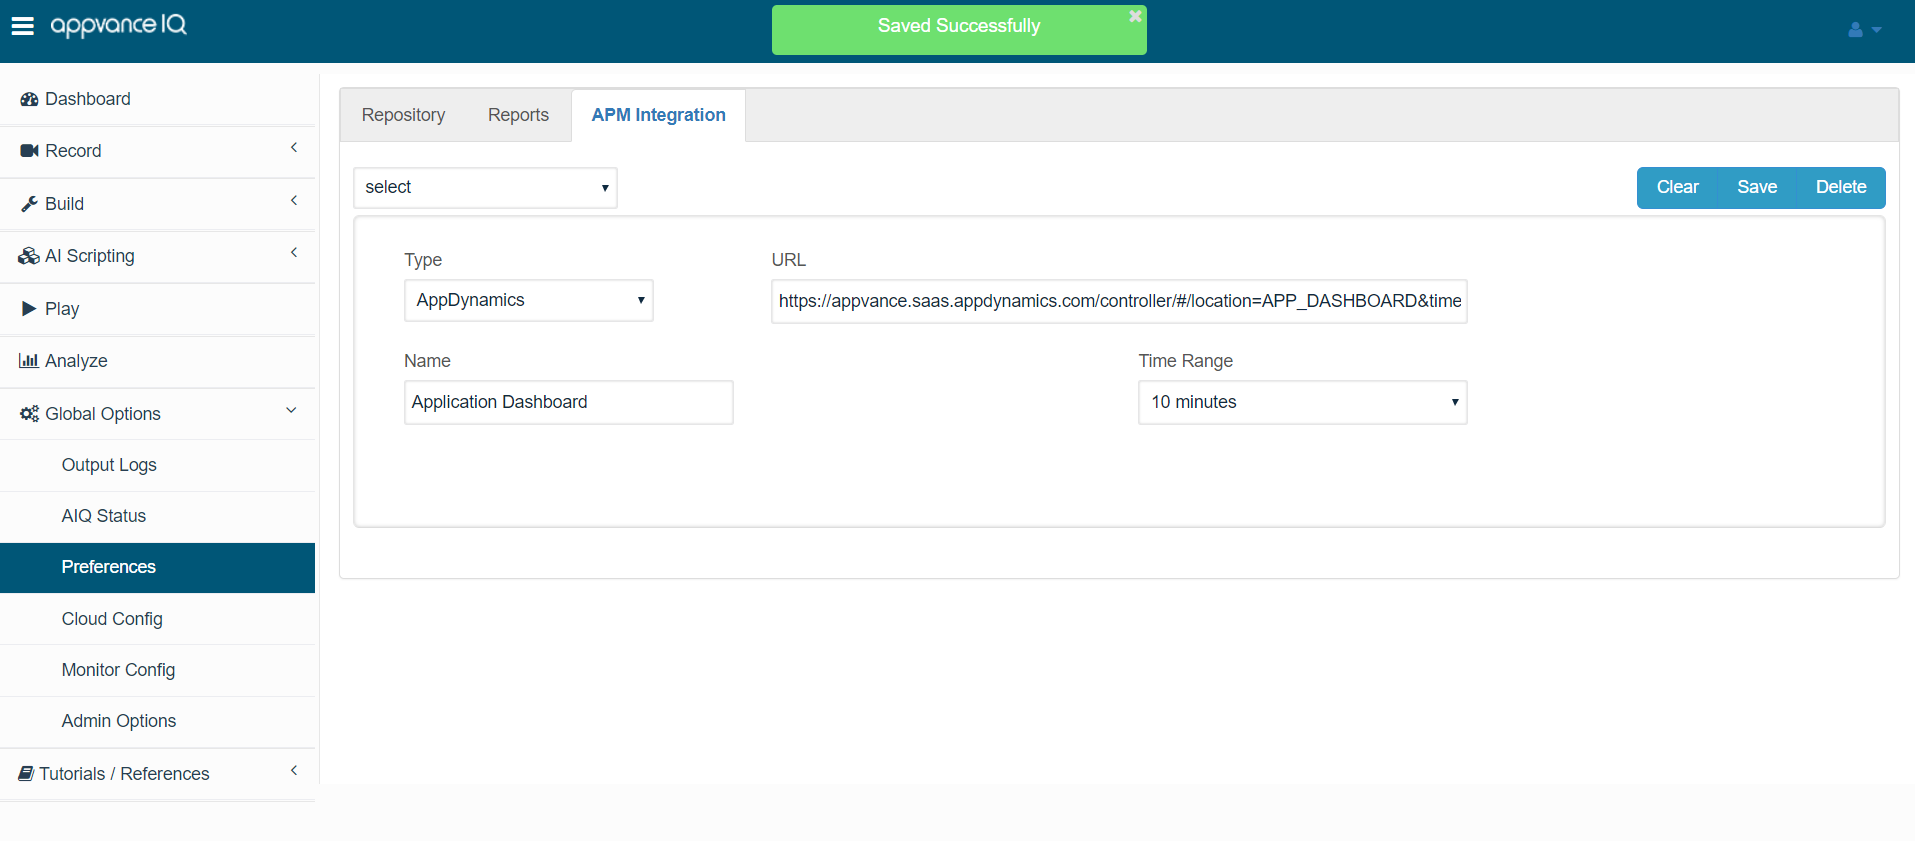
Click Save.
Once the configuration is saved, go to the Scenario Builder and create your performance test on the application, save and run the scenario.
Note: No configuration changes are required in the Scenario Builder, it is required to save more percentage of logs in the Options panel of Scenario Builder so AIQthe runsTest case execution graph shows some data (Example: 10% logs)
While the test is running (The reports shall be available during the test run and after the test is complete as well), on the Analyze page, Select Test Case Executions from the drop-down, you will notice a lot of executions that is happening for the performance test. Select Iteration and Test case from the drop-down
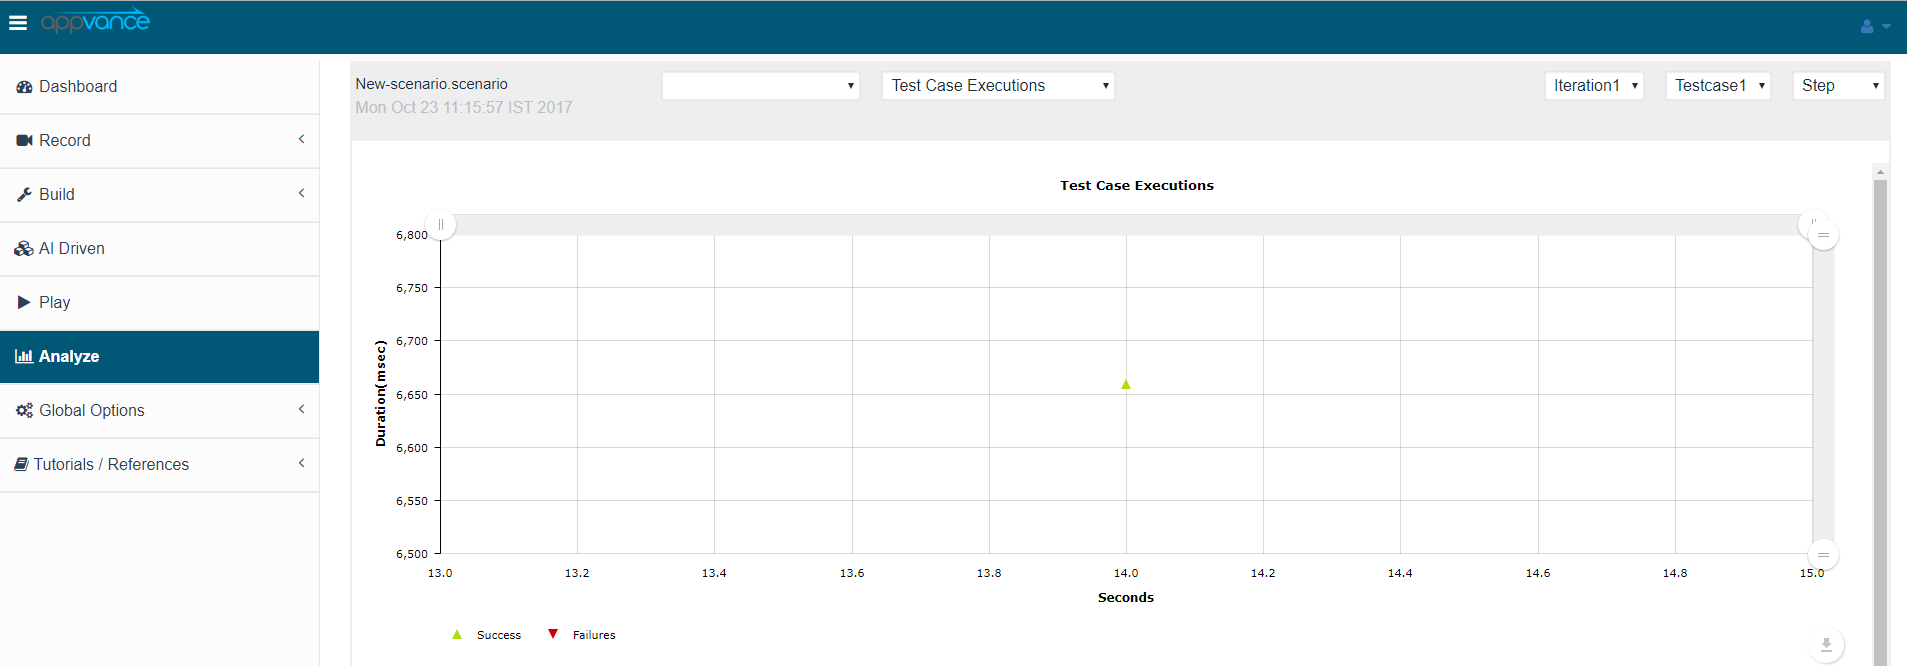
Click any of these small triangles that are plotted over the period of time and these are the executions that happened
You will notice buttons (with what was configured at the global options for AppDynamics) at the bottom for each of these executions, you can simply click this button which will take you to the New Relic dashboard page at that point in time
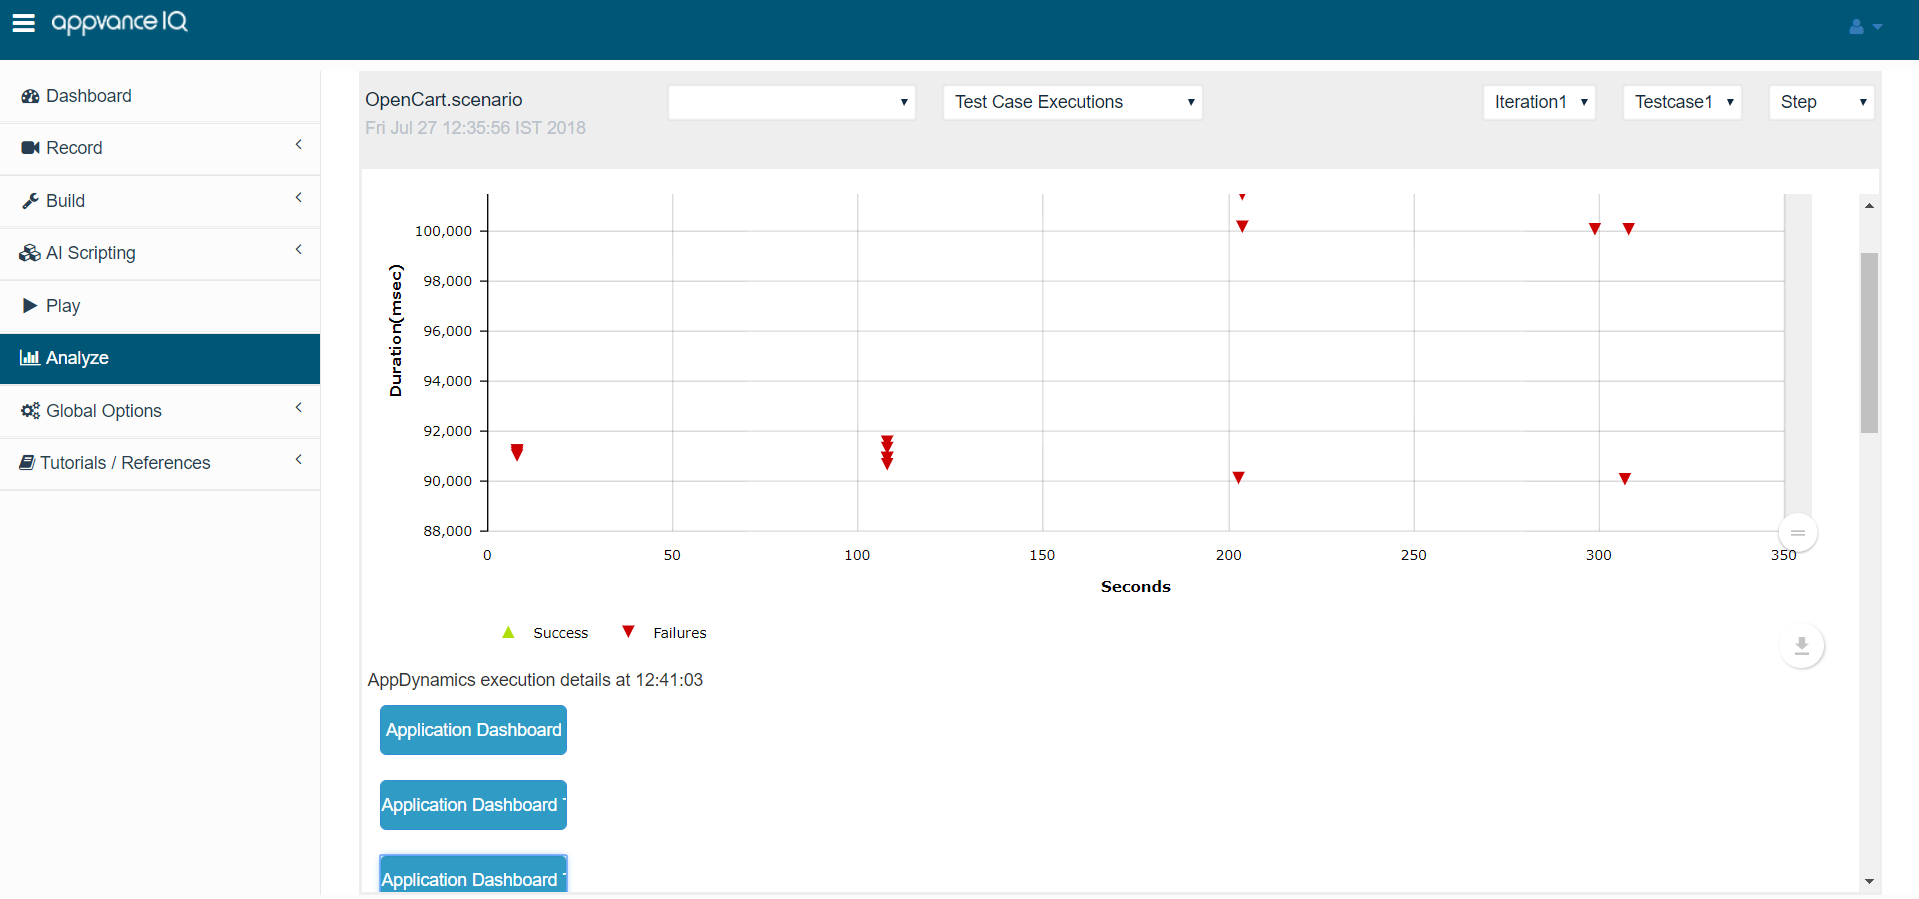
For the pages where credentials are required to log in to AppDynamics, it is required to provide the credentials.
Similarly, you can click any small triangle on this page and click the buttons to check the app performance over the period of time from AppDynamics.
To add, any number of configurations or processes can be reviewedadded alongsideto applicationthis performancelist data.
Recommendedshall guidance
be Usedisplayedapprovedonservicethecredentialssame page which you can click during that time and go to AppDynamics to check the dashboard ortokens and never paste secrets into documentation.Verifythecontrollerreports.URL,
Validation workflow
Collect the AppDynamics connection details from the monitoring owner.Enter the integration settings in AIQ and save the configuration.Run a small scenario and confirm AppDynamics data is available for the expected time window.
Note: Treat AppDynamics tokens and credentials as secrets. Store them only in the approved secure location.
Last updated: SeptemberJuly 24,18, 20262023
If you have any feedback on this topic, please contact us at documentation@appvance.ai.