Exploring Blueprint Results
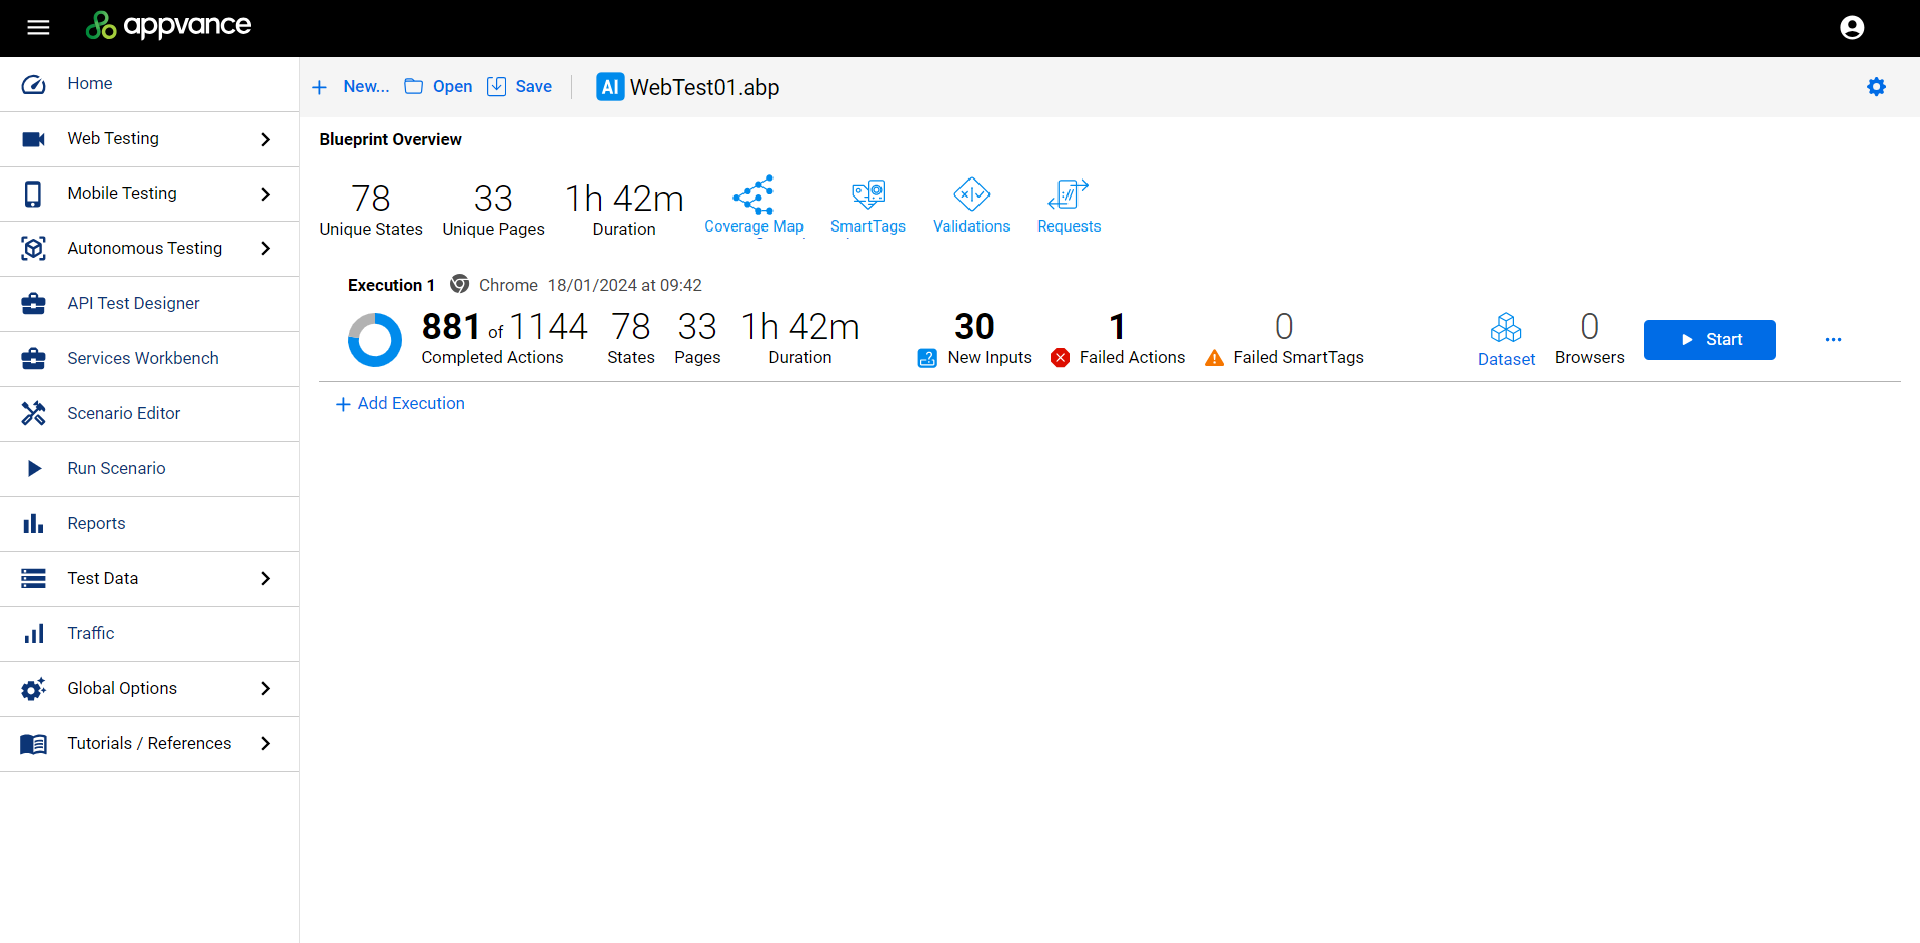
This is what the new Blueprint Overview, or Blueprint Dashboard looks like while a Blueprint is running or after a Blueprint has run. From here you can see the details of what the Blueprint found and interpret the results.
In the previous implementation of Blueprinting (pre-AIQ 5.0), when the Blueprint ran you could see watch the browsers navigate your application in real time. Because of headless mode you will no longer see that happen in real time.

The following table details the icons and controls in the Blueprint Dashboard.
| Icon / Control | Function |
|---|---|

|
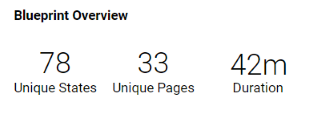
Blueprint Overview shows you a summary of all executions of the blueprint.
|

|
Click Coverage Map to launch the coverage map. The Coverage Map shows you the multiple paths that the AI can take while interacting with the application being tested. See Exploring the Coverage Map for information on interacting and interpreting the Coverage Map. |
|
|
This button is only visible if your Blueprint uses SmartTags. See Exploring SmartTags for more information. |
|
|
This button is only visible if your Blueprint uses Validations. See Exploring Validations for more information. |

|
Displays all the requests made by the Blueprint. See Failed Requests and Failed Actions. |

|
Execution details shows you a summary of a particular blueprint execution.
|

|
Click New Inputs to open the Pages information of the execution. See Pages and States for more information. This replaces the Inputs Found button in the previous Blueprint user interface. |

|
Click Failed Actions to see the details for the selected execution. From there you can see the pages with failed actions for the selected execution. |

|
Click Failed SmartTags to see the failed SmartTags for the execution. See Exploring SmartTags for more information. |

|
Allows you to add execution data from the Blueprint Dashboard. See the "Data and Datasets" information in Add an Execution for more information. |

|
Displays the number of browsers that are running the Blueprint. This is set in the Add Execution page. |

|
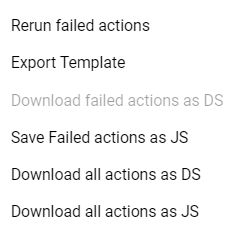
See Failed Requests and Failed Actions for information on how to interpret the various downloaded data. |
|
|
Adds a Blueprint execution. At least one execution is required per Blueprint. See Add an Execution for more information. |
|
|
View your configuration settings. This is information only. Blueprint configurations cannot be modified after the Blueprint has been executed. See Modifying Blueprint Configuration Settings for more information. |

